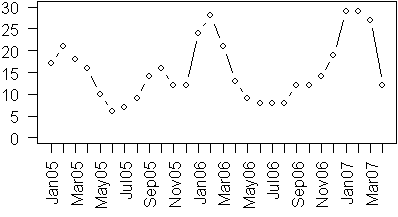
One of the doctors brought by a data set that showed the average volume of business (number of beds filled) in a month for 28 consecutive months starting in January 2005. Here is the data:
17,21,18,16,10,
 6, 7, 9,14,16,
12,12,24,28,21,
13, 9, 8, 8, 8,
12,12,14,19,29,
29,27,12`
Here is a plot of the 28 consecutive values.
and here is the plot aligning the months in a given year (5=2005, 6=2006, 7=2007).
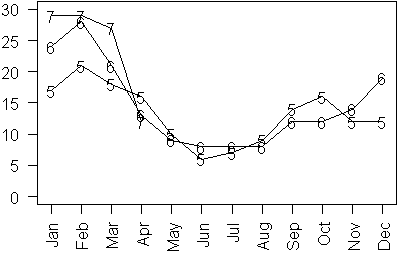
Notice that the number of beds filled is highest in the wintertime and lowest in the summertime. Also notice that there is slight upward trend over time. If you were trying to estimate the magnitude of this slight upward trend, you would need to account for the cyclical pattern as well. A simple way to estimate a cyclical pattern is to use a bit of trigonometry. Do you remember the sine function from your trig class in high school? Here is an example of a sine wave.
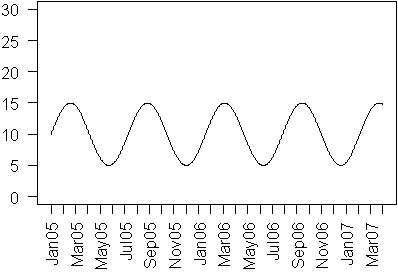
Notice that it has a cyclical trend with regular peaks and troughs, but this is not the sine wave that we want to fit to our data. To fit a sine wave properly, you need to estimate three quantities: the amplitude, the period/frequency, and the phase.
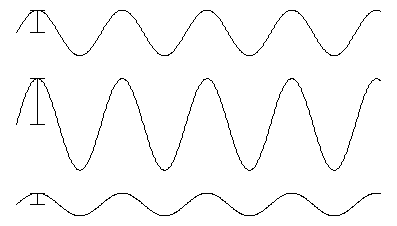
Amplitude is the distance from the middle of the sine curve to the peak (or equivalently, the distance from the middle to the trough).
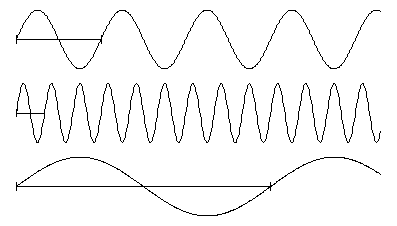
Period is the distance that a sine wave travels before it repeats itself. Period is inversely related to frequency. You can define the frequency as the number of times (sometimes a fractional number of times) that a sine wave repeats in the interval 0 to 2pi.
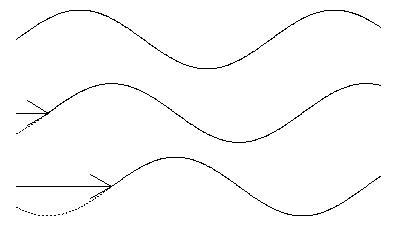
Phase is the amount that the sine wave is shifted from the origin.
In our example, we know the period (12 months), but we need to calculate the amplitude and the phase. Problems where the period/frequency is unknown represent a special challenge and use approaches like Fourier analysis. I want to skip the complexities of Fourier analysis for now, because estimating period/frequency and phase is already more than enough challenge. One formula that will produce a sine wave with a period of 12 and variable amplitude and phase is

This is a nonlinear model, because the term phi is inside the sin function. We can find a more convenient form that does not require the use of nonlinear regression by remembering the formula for the sine of a sum of two angles

If you apply this formula, the equation changes to

where

and

With a bit of work, you can show that the amplitude and phase are simple functions of B and C.


The code in R to fit a linear trend in the presence of cyclical variation is
t <- seq(0,27)
sint <- sin(2*pi*t/12)
cost <- cos(2*pi*t/12)
lm.0 <- lm(x~t+sint+cost)
The results of this fit are
Coefficients:
(Intercept) 12.5009
t            0.1550
sint         1.7619
cost         7.6939
and you can compute the amplitude as
sqrt(1.7619^2+7.6939^2)
[1] 7.89306
This means that the peak season has about 8 more filled beds than the overall yearly average and the slow season has about 8 fewer filled beds than the overall yearly average. The phase is computed as
> atan(-7.6939/1.7619)*12/(2*pi)
[1] -2.570058
Notice that the sine wave starts to the left of zero, but since it repeats every 12 months, you can compute an alternate starting point as
> 12-2.570058
[1] 9.429942`
This tells you that the start of the sine curve is in mid-September. This starting point is the halfway marker between the trough and the peak. You can find the location of the trough and peak by simply subtracting and adding three months, respectively. Thus, the low point for number of beds occurs in mid-June (6.429942) and the high point occurs in mid-January (12.429942 or equivalently 0.429942).
The linear trend term is 0.1550 which tells you that the number of filled beds increases on average by about 0.155 per month (or equivalently 1.86 filled beds per year).
Here is a plot of the data and the estimated equation.
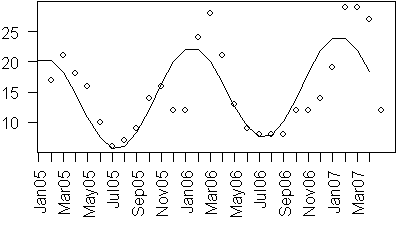
The model used here is overly simplistic for two reasons. First, it fails to take advantage of the fact that counts often followed a Poisson distribution. Second, it fails to exploit the tendency for consecutive months values to exhibit a positive autocorrelation. When I have time, I will illustrate how to produce a more complex model that accounts for these facts.
You can find an earlier version of this page on my old website.