There are several research projects where I am actively looking for collaborators. I thought I’d outline these topics briefly here.
First, I am very interested in analyzing adverse events in clinical trials. It is very difficult to make good decisions about whether the number of adverse events have accumulated to a point where some action must be taken. The decisions are often made using qualitative
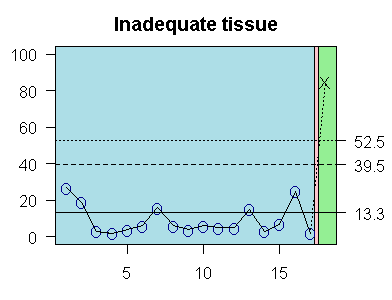
I am proposing the use of control charts to monitor adverse events. I have an interesting “twist” on these control charts because I am monitoring time gaps (also called waiting times) rather than monthly or quarterly rates. These time gaps have several advantages. and in certain situations can be shown to be equivalent to a number needed to harm calculation. Here’s a simple example of the type of charts I am working on.

Second, I am interested in developing good tools for monitoring accrual rates in clinical trials. There are too many clinical trials that start with good intentions but then flounder because they do not get enough patients enrolled. They might plan to recruit a hundred patients in a year, but after two years, they still only have a dozen patients in the study.
In some sense, accrual problems are the flip side of the coin from adverse events. You worry about an adverse event when it occurs too rapidly, and you worry about accrual when it occurs too slowly.
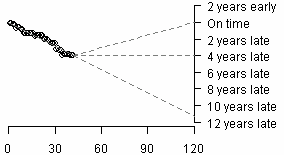
The key to accrual is to estimate the date gap or waiting time between successive patients and model this distribution of waiting times. I am working with a colleague at Kansas University Medical Center to use a Bayesian model to predict the ultimate fate of the accrual process. I also am investigating how control charts, especially CUSUM charts can help monitor the accrual process. Here’s an example

Third, I am interested in the recent effort to publicly or privately evaluate the work of individuals or groups in health care. These analyses are called “league tables” or “report cards” and they stir up a lot of controversy. The most critical issue is risk adjustment, or the need to take into account the differing mix of patients that individual or groups might have. Otherwise, any comparison will be an “apples to oranges” comparison.
While the need for risk adjustment (or related approaches like risk stratification) are indeed important, what gets lost in the shuffle is the sheer volume of comparisons that could be made in this setting. If a report card compares the performance of 50 hospitals, you could make a comparison between the first and second hospital, between the first and third hospital, etc. There are exactly 1,225 of these pairwise comparisons.
A more rational approach to this is to compare each individual or group to an overall average. This allows you to identify who is performing significantly better than the overall average and who is performing significantly worse than the overall average. It does not allow you to examine how each individual or group compares to the best, so you do miss some interesting comparisons. But comparing each individual or group to an overall average allows you to focus on an important question and it does greatly reduce the number of potential comparisons.
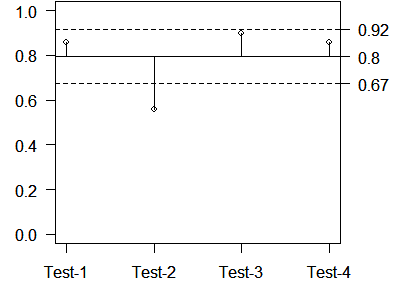
This approach of looking at deviations from an overall average rather than looking at all pairwise comparisons is called Analysis of Means (ANOM) and it is an underutilized and underappreciated methodology. I have some interesting ideas about using randomization tests to produce decision limits in ANOM.
Here’s an example of an ANOM chart

A common theme for all three of these areas is that they lend themselves well to simple graphical summaries. I have always enjoyed the more visual applications of statistics (like regression analysis) and I believe that a single well constructed graph can provide a wealth of information.
An earlier version of this page has been lost.