I’ve been asked to establish that a particular program, OpenEpi, can accurately calculate test statistics for a two by two table. The package appears quite good, and it is written by some really smart people, which would have been good enough for me, but I do understand that others feel the need to go an extra step. So here is how you might establish accuracy.
First, you would find some examples published in the peer-reviewed literature. Then you show that the p-values and/or confidence intervals that appear in those publications can be duplicated in the OpenEpi program. If there is a discrepancy, bring in a third program (SAS, SPSS, Stata, or R) and adjudicate. You establish accuracy if the software can replicate a range of problems published in the peer-reviewed literature, and the only discrepancies are errors in the peer-reivewed publication (yes it does happen, and more often than you might think). Here are a few examples.
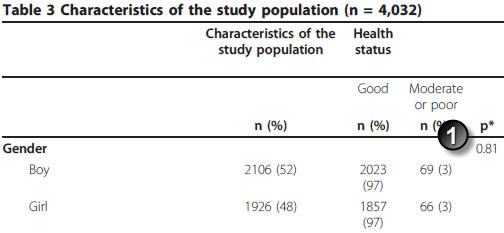
Journal article: Sanna Siponen, Riitta Ahonen, Piia Savolainen, Katri Hameen-Anttila. Children’s health and parental socioeconomic factors: a population-based survey in Finland BMC Public Health. 2011;11(1):457. [Accessed on July 14, 2011]. http://www.biomedcentral.com/1471-2458/11/457
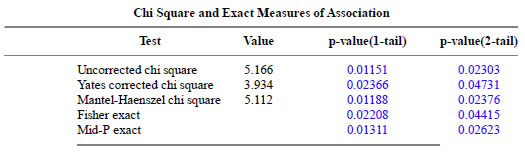
Note in this example that there are 17 missing values (14 among boys and 3 among girls). Here are the results from OpenEpi.
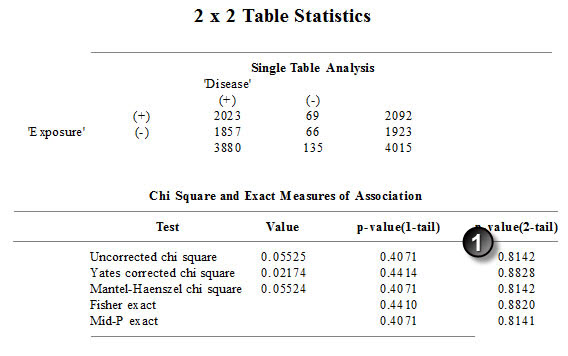
You need to take the time to verify that the paper used the uncorrected chi square test, which it does. This is a perfect match.
Here’s another example:
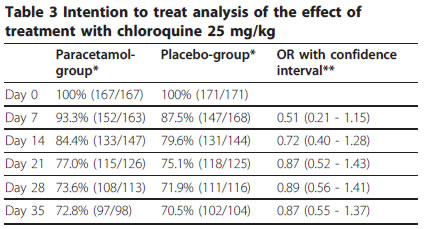
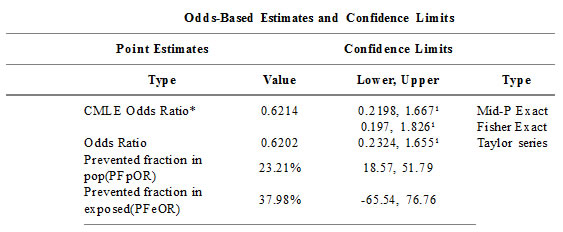
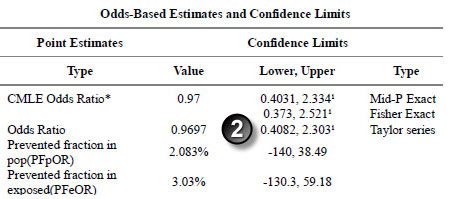
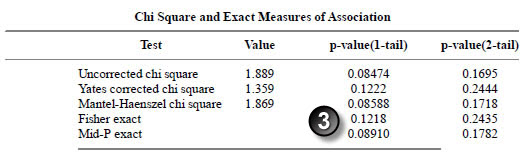
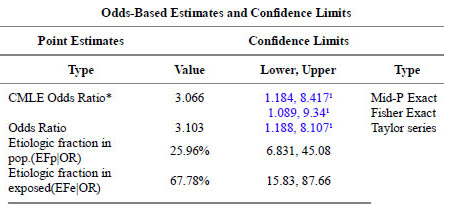
Poul-Erik Kofoed, Johan Ursing, Amabelia Rodrigues, Lars Rombo. Paracetamol versus placebo in treatment of non-severe malaria in children in Guinea-Bissau: a randomized controlled trial Malaria Journal. 2011;10(1):148. [Accessed on July 14, 2011]. http://www.malariajournal.com/content/10/1/148
with the relevant analyses in OpenEpi
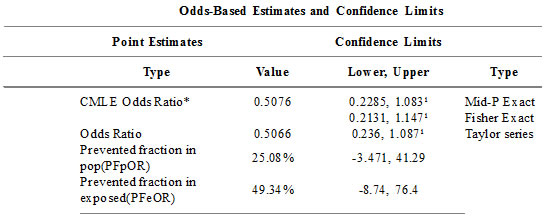
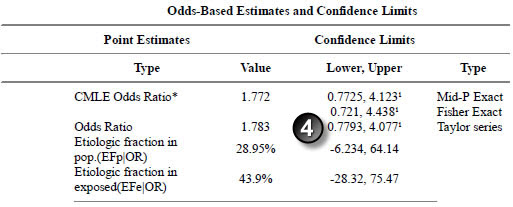
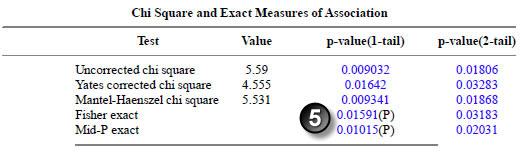
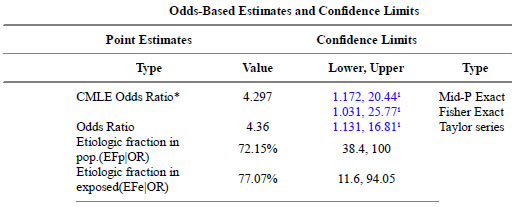
Note that oods ratio and Fisher Exact confidence intervals match the intervals for Day 7 reported in the paper. But the results in Day 14 don’t match.
Uh-oh. Time to bring in SPSS.
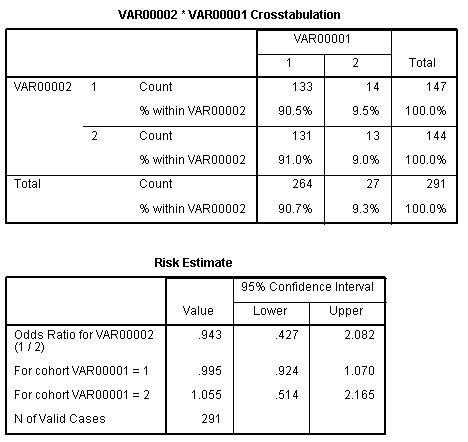
Notice that the odds ratio and confidence interval in SPSS match the Taylor Series confidence interval in OpenEpi. What’s happening in the peer-reviewed paper is that dropouts are occuring, and are being treated according to some method (Intention to Treat, perhaps) to get a different proportion. Notice that the fractions 133/147 and 131/144 are not equal to 84.4% aqnd 79.6% as reported in the paper, but rather 90.5% and 91%.
Let’s drop this example from our accuracy testing. There are hundreds of other good examples, and there’s no need to confuse the issue. If the results in SPSS had matched the paper and not OpenEpi, though, we would definitely have to report this as an example where accuracy does not hold.
Here’s another example:
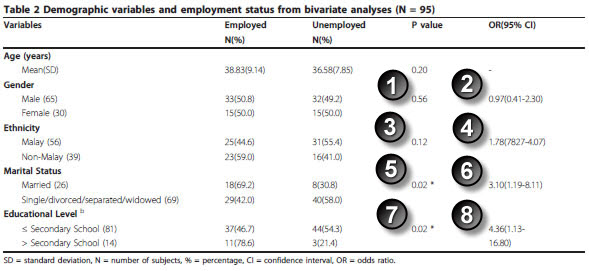
Journal article: Marhani Midin, Rosdinom Razali, Ruzanna ZamZam, Aaron Fernandez, Lim C Hum, Shamsul A Shah, Rozhan SM Radzi, Hazli Zakaria, Aishvarya Sinniah. Clinical and cognitive correlates of employment among patients with schizophrenia: a cross-sectional study in Malaysia Int J Ment Health Syst. 2011;5(1):14. [Accessed on July 14, 2011]. http://www.ijmhs.com/content/5/1/14.
You have to skip the age variable, but you can replicate the two by two tables for gender, ethnicity, marital status, and eduation level.
Here are the results for gender:
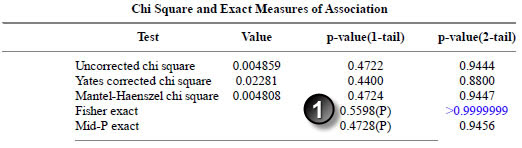
The Fisher exact p-value matches the p-value in the paper.
The Taylor Series confidence interval matches the interval in the paper.
Here are the results for ethnicity.
The p-values match.
The confidence intervals match (let’s allow a bit of latitude for rounding error here).
Here are the results for marital status.
The p-values match.
The confidence intervals match.
Here are the results for education level.
The p-values match.
The confidence intervals match.
So how many examples do you need to establish accuracy. It’s a subjective call. You should try for a range of sample sizes, at least one less than 100, and at least one greater than 1,000. You should also try to get a mix of statistically significant and statistically insignificant examples. You should also try to get examples using the major methods (uncorrected chi square and Fisher exact p-values, Fisher exact and Taylor series confidence intervals).
You should also establish accuracy by generating artificial examples and running them both in OpenEpi and in a well established software package. I will write up details about this in a future webpage.
You can find an earlier version of this page on my original website.