I found a pair of data sets on the web that represent counts and where one goal of the data collection is to see if any of the individual counts differ from the overall average. They look quite similar and you might be tempted to analyze both of them using a control chart. But the second example is different in subtle, but important ways and it is better analyzed using an approach called Analysis of Means (ANOM).
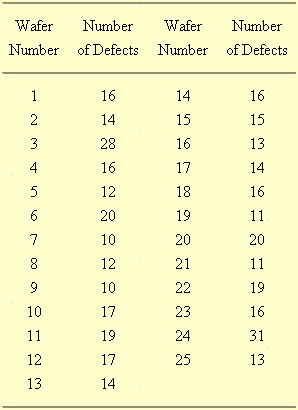
The first example comes from the NIST/SEMATECH e-Handbook of Statistical Methods. This data set comes from a semiconductor manufacturing plant. The plant produces wafers, each of which contains a hundred chips. These wafers will have defects on them and we want to monitor the rate at which defects occur to see if there is a shift for the better or for the worse in manufacturing quality.

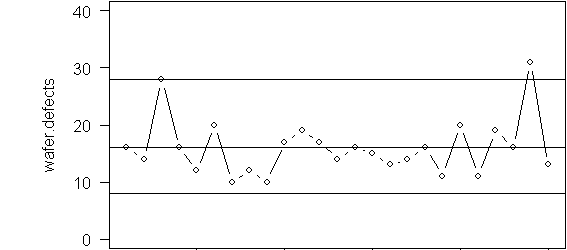
The average rate of defects is 16. Did any wafers produce defects above the average of 16? You could take this literally and point out that the 3rd, 6th, 10th, etc. chips were above the average of 16. But you only want to identify wafers that are above average after accounting for the uncertainty inherent in this process. A control chart (in this particular case a C chart) works well for this data.

The control limits are 8 and 32. Look for a single point outside the control limits (wafer #24) or eight consecutive points on the same side of the center line (no such examples in this chart). Some people will divide the control charts into three zones and use rules like 2 out of 3 consecutive points in Zone A, or 4 out of five consecutive points in Zone B.
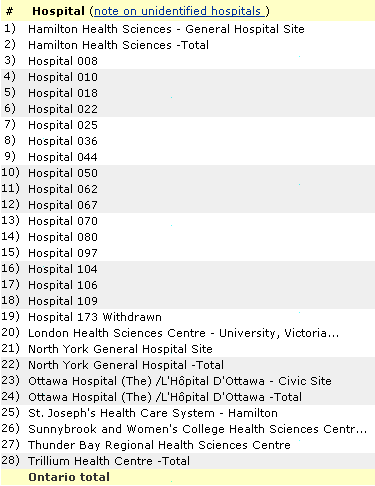
The Fraser Institute produces an Ontario hospital report card on a variety of measures. One measure if the volume of procedures performed at various hospitals. There is some evidence that hospitals that perform a large volume of procedures have better outcomes (an application, perhaps, of the old saying “practice makes perfect”). Here is the data on the number of carotid endarterectomy procedures performed in 2004-2005. Some material in the middle of the web page was removed to shrink the image size and to delete some data that is extraneous to this particular discussion.


The average hospital performs 52.5 procedures. Which hospitals perform more than the overall average? Your first instinct might be to use a control chart again, and while this is not a terrible first step , it does raise some issues. Most importantly, a control chart is, ore or less , a run chart with, a plot of the data in time sequence. There is no time sequence for this data set. Each hospital started counting procedures in January 2004 and stopped in December 2005. You could place the data in alphabetical order, but that is a rather arbitrary choice, and then what would you do with the hospitals that are unidentified? If a hospital changed it’s name, would you redraw the graph?
There’s another difference and this is much more subtle. A control chart represents a continuous monitoring of a work process. Although there are some practical limits on the number of points in a control chart, there is no obvious upper bound that you can readily identify. You just keep on monitoring the quality of wafers until the factory closes or until it switches to a different product.
Because a control chart has no obvious upper limit on its length, its working characteristics are defined in terms of average run lengths. The average run length is the number of data points that you would have to place on the chart on average, before a point is declared to be out of control. You want the average run length to be large (in the hundreds) if the process actually is in control and to be small if the process is actually out of control. The control limits are defined to optimize the average run length.
With the hospital example, the size of the chart is limited to the number of hospitals in Ontario (actually, the number in Ontario that actually perform carotid endarterectomy). An average run length statistic is meaningless here because the number of hospitals is fixed. As a results the control limits defined in terms of average run length may be too conservative or too liberal.
Instead, you should use a criteria that controls the probability that one or more hospitals will be identified as performing above or below the overall average. The general procedure for comparing a fixed number of groups to see if one group deviates significantly from the overall average is called analysis of means (ANOM).
The ANOM model can be used for continuous outcomes, though it relies on an assumption of normality. It can also be used with proportions and rates as long as the sample sizes are sufficiently large that a normal approximation would hold.
The general formula for balanced data is

where I is the number of groups and N is the total sample size. If there are n observations in each group, then N=nI. The quantity N-I represents the degrees of freedom for the pooled estimate of standard deviation. The table for h can be found in The Analysis of Means. Peter R. Nelson , Peter S. Wludyka, Karen A.F. Copeland (2005) Philadelphia, PA: SIAM. BookFinder4U link
You can also compute the critical value using a multivariate t-distribution. There are a few complications. First the distribution you are trying to describe represents deviations from an overall mean, so there will be correlations in the data since each group contributes to the overall mean. This correlation, -1/(I-1), is the same for any pair of deviations. Second, the sum of the deviations must equal zero, so this produces a degenerate distribution. This degeneracy means that there is no inverse for the correlation matrix.
In R, there is a library, mvtnorm, that will allow you to compute the percentiles needed for ANOM. Here’s an example:
i <- 25
co <- matrix(-1/(i-1),nrow=i,ncol=i)
diag(co) <- rep(1,i)
qmvt(p=0.95,tail="both.tails",corr=co,df=5000)
For count data, you need to modify the formula slightly to
[Formula is misplaced. I will try to restore it soon.]
and there are further modifications if the data represents proportions or rates, or if the sample size is unequal between groups. In this example, I=25 (three of the data values are redundant). The upper and lower limits are 31 and 74.

Seven hospitals have volume above the overall average and twelve have volume significantly below the overall average.
You can find an earlier version of this page on my old website.