On the web page
Stats: Calculation of Analysis of Means limits
you were asked to calculate ANOM charts for two different data sets.
The first data set is reproduced below.
A 14 39
B 60 20
C 26  9
D  9 12
E 36 21
F 53 18
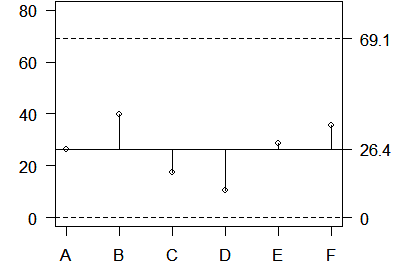
The summary statistics are
  Mean Var   Stdev
A 26.5 312.5 17.68
B 40.0 800.0 28.28
C 17.5 144.5 12.02
D 10.5   4.5  2.12
E 28.5 112.5 10.61
F 35.5 612.5 24.75`
The average of the individual means is 26.4 and the average of the individual variances is 331.1. The square root of this value is 18.2 which represents the pooled standard deviation.
In this example, I is 6 and N is 12. The critical value h is 3.62. The upper decision limit is
$26.4+3.62 \sqrt{331.1 \frac{5}{18}}=61.4$

26.4+3.62*18.2*v5/18=61.4
The lower decision limit is less than zero. Since negative values are impossible in this setting, you should not plot this value. Here is a graphical display.

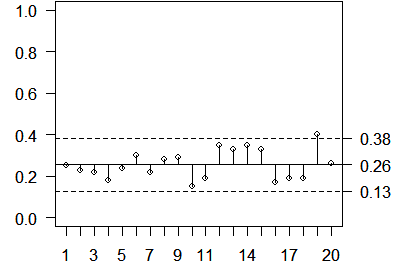
The second data set represents proportions and is reproduced below.
25 23 22 18 24 30 22 28 29 15
19 35 33 35 33 17 19 19 40 26`
The average of these 20 proportions is 0.26. In this example, I=20 and N=2000. The critical value h is 3.02. The upper and lower decision limits are
$0.26-3.02 \sqrt{0.26(1-0.26) \frac{(19}{2000})}=0.13$ $0.26+3.02 \sqrt{0.26(1-0.26) \frac{(19}{2000})}=0.39$
Here is a graphical display of the individual proportions and the decision limits.

You can find an earlier version of this page on my old website.