The following 41 observations:
8, 2, 26, 29, 1, 2, 11, 8, 0, 5, 10, 1, 4, 9, 12, 3, 6, 5, 2, 12, 1, 5, 3, 5, 7, 0, 2, 8, 3, 3, 1, 0, 4, 8, 1, 8, 12, 0, 6, 1, 5
represent waiting times that we suspect follow an exponential distribution. There are several ways to examine this belief.
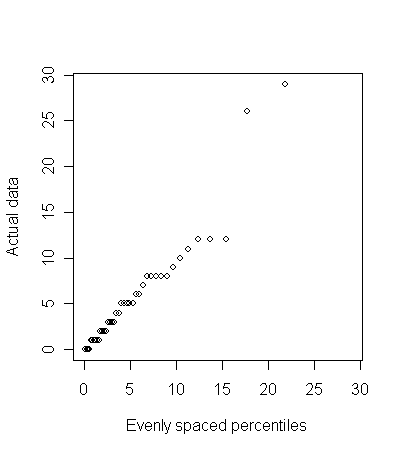
The simplest way to to draw a Q-Q plot for the exponential distribution.
You need to compare the sorted values of the waiting times with 41 evenly spaced percentiles from an exponential distribution. Since the exponential distribution represents a family of distributions, you need to select a particular distribution. The easiest choice is to select the distribution that has the same mean as the actual data (5.83). These percentiles can be obtained in R using the following line of code
qu <- qexp((1:41)/42,rate=1/5.83)
which produces the following values (after rounding)
0.1, 0.3, 0.4, 0.6, 0.7, 0.9, 1.1, 1.2, 1.4, 1.6, 1.8, 2.0, 2.2, 2.4, 2.6, 2.8, 3.0, 3.3, 3.5, 3.8, 4.0, 4.3, 4.6, 4.9, 5.3, 5.6, 6.0, 6.4, 6.8, 7.3, 7.8, 8.4, 9.0, 9.7, 10.4, 11.3, 12.4, 13.7, 15.4, 17.7, 21.8
Plotting these values yields the following graph.
 height=“452”}
A straight line is evidence of consistency between the data and the exponential distribution. Note that the two largest data points seem out of line, but a fair amount of latitude should probably be allowed at the upper tail. You can simulate these graphs under an actual exponential distribution to get a feel for sampling error.
This approach can be applied to other distributions as well. Note that in many situations, it simplifies the interpretation by selecting the distribution using the same mean (as above) or in some settings the same mean and standard deviation. This is knwon as matching the moments and is actually an optional step for most Q-Q plots.
The Q-Q plot does not provide a formal test of hypothesis and there is a tendency to overstate small departures from linearity. Still, it is a useful approach that is easy to explain.
You can find an earlier version of this page on my original website.