I’m helping someone who is looking at a secondary data analysis that involves a complex sampling schemes. This means that the survey used cluster sampling, and/or stratified sampling, and/or survey weights. You need to learn specialized software if you want to analyze complex surveys data properly. Here’s how you would do it in SPSS.
I’m using as an example the 2012 emergency department data from NHAMCS. I first downloaded the raw data, but then I found an SPSS file with value and variable labels and some (but not all) missing value codes.
You also need to read the documentation, available in PDF format.
and especially Appendix I (A). In particular, the appendix tells you
To obtain variance estimates which take the sample design into account, IBM SPSS Inc.’s Complex Samples module can be used. This description applies to version 21.0. From the main menu, first click on ‘Analyze’, then ‘Complex Samples’, then ‘Prepare for Analysis’. The ‘Analysis Preparation Wizard’ can be used to set CSTRATM as the stratum variable, CPSUM as the cluster variable, and PATWT as the weighting variable.
I’m using version 22, but things haven’t really changed. Here’s the first dialog box.
I choose a boring name (ed2012plan) and clicked on the NEXT button.
Then I put the CSTRATM, CPSUM, and PATWT variables in the appropriate spots and clicked on the FINISH button (actually I peeked at what happens if you click NEXT and decided that I wanted the default options all the way through). I decided to run frequencies
The system gave me a warning message
I’ll investigate this later and report back to you.
Here are the options under the Statistics button.
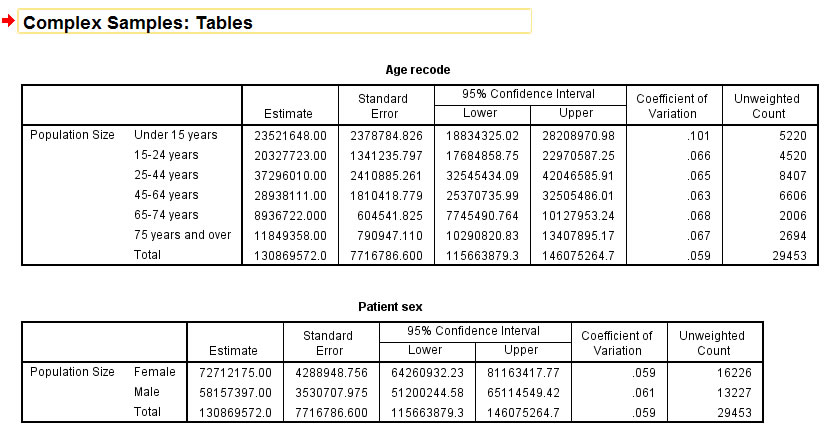
Here’s the output.

Here’s the dialog box for Descriptives
and the dialog box you get when you click on Statistics
and the output.

If you want to compare means across different demographic groups, use the Subpopulations field.
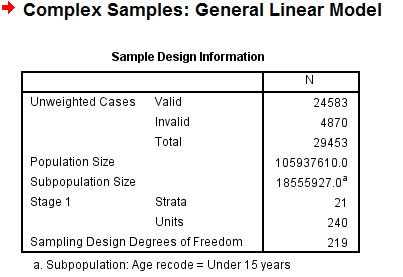
Here is the output.

Here is the dialog box for the linear regression model.
and the dialog box behind the Model button
and the output.

There was an earlier version of this page on my blog but I can’t locate it anymore.