Someone on EDSTAT-L asked about a problem involving differences of independent normal random variables. I am simplifying the problem a bit, but it essentially asked a question that was comparable to the following:
Suppose you have three independent standard normal random variables: A, B, and C. What is the probability that A is smaller than B by one or more units and A is also smaller than B by one or more units.
This is equivalent to calculating the following probability.
If you redefine X=A-B and Y=A-C, then this probability changes to
where X and Y are correlated normal random variables with covariance matrix

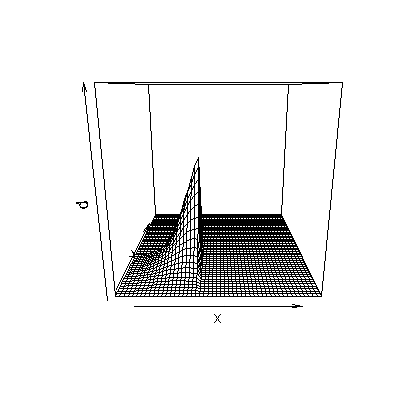
The density function represented by this pair of correlated normal random variables looks like the following:
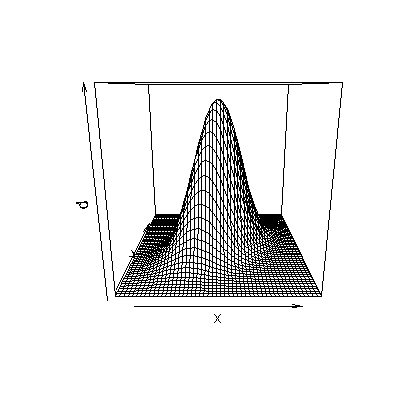
Notice the classic image of a bell shaped curve, but now it is in three dimensions rather than two. Note also that the width of the bell curves varies with the widest bells along the line x=y and the narrowest bells perpendicular to the line x=y. The probability shown above is equivalent to integrating the following portion of the bell shaped curve:
R has a library for calculation of multivariate t and multivariate normal distributions. You can compute the probability in question using the following R code.
s <- matrix(c(2,1,1,2),nrow=2)
pmvnorm(upper=c(-1,-1),mean=c(0,0),sigma=s)
which produces a probability of 0.1132. The calculation you would use if X and Y were independent
s <- matrix(c(2,0,0,2),nrow=2)
pmvnorm(upper=c(-1,-1),mean=c(0,0),sigma=s)
produces an incorrect answer (0.0575), which you could also get by multiplying the probability that two independent normal random variables with mean 0 and variance 2 would be less than -1.
pnorm(-1,mean=0,sd=sqrt(2))^2
The moral of this story is that when two events are correlated, you can’t just get a bivariate probability by multiplying the univariate probabilities.
You can find an earlier version of this page on my old website.