I wanted to show a couple of Cox proportional hazards regression models in R for a talk I am giving for the R users group.
This builds on the work in the previous two blog entries.
This is the documentation of the data file.
# Documentation found at http://lib.stat.cmu.edu/datasets/pbc
# The data set is a study of primary biliary cirrhosis
# Variables:
# V1  case number
# V2  number of days between registration and the earlier of death,
#     transplantion
- or study analysis time in July
- 1986
# V3  status
#     0=censored
- 1=censored due to liver tx
- 2=death
# V4  drug
#     1= D-penicillamine
- 2=placebo
# V5  age in days
# V6  sex
#     0=male
- 1=female
# V7  presence of asictes
#     0=no 1=yes
# V8  presence of hepatomegaly
#     0=no 1=yes
# V9  presence of spiders
#     0=no 1=yes
# V10 presence of edema
#     0   = no edema and no diuretic therapy for edema;
#     0.5 = edema present without diuretics
- or edema resolved by diuretics;
#     1   = edema despite diuretic therapy
# V11 serum bilirubin in mg/dl
# V12 serum cholesterol in mg/dl
# V13 albumin in gm/dl
# V14 urine copper in ug/day#
# V15 alkaline phosphatase in U/liter
# V16 SGOT in U/ml
# V17 triglicerides in mg/dl
# V18 platelets per cubic ml / 1000
# V19 prothrombin time in seconds
# V20 histologic stage of disease
The dataset is already part of the survival package.
library("survival")
## Loading required package: splines
head(pbc)
##   id time status trt      age sex ascites hepato spiders edema bili chol
## 1  1  400      2   1 58.76523   f       1      1       1   1.0 14.5  261
## 2  2 4500      0   1 56.44627   f       0      1       1   0.0  1.1  302
## 3  3 1012      2   1 70.07255   m       0      0       0   0.5  1.4  176
## 4  4 1925      2   1 54.74059   f       0      1       1   0.5  1.8  244
## 5  5 1504      1   2 38.10541   f       0      1       1   0.0  3.4  279
## 6  6 2503      2   2 66.25873   f       0      1       0   0.0  0.8  248
##   albumin copper alk.phos    ast trig platelet protime stage
## 1    2.60    156   1718.0 137.95  172      190    12.2     4
## 2    4.14     54   7394.8 113.52   88      221    10.6     3
## 3    3.48    210    516.0  96.10   55      151    12.0     4
## 4    2.54     64   6121.8  60.63   92      183    10.3     4
## 5    3.53    143    671.0 113.15   72      136    10.9     3
## 6    3.98     50    944.0  93.00   63       NA    11.0     3
tail(pbc)
##      id time status trt      age sex ascites hepato spiders edema bili
## 413 413  989      0  NA 35.00068   f      NA     NA      NA     0  0.7
## 414 414  681      2  NA 67.00068   f      NA     NA      NA     0  1.2
## 415 415 1103      0  NA 39.00068   f      NA     NA      NA     0  0.9
## 416 416 1055      0  NA 56.99932   f      NA     NA      NA     0  1.6
## 417 417  691      0  NA 58.00137   f      NA     NA      NA     0  0.8
## 418 418  976      0  NA 52.99932   f      NA     NA      NA     0  0.7
##     chol albumin copper alk.phos ast trig platelet protime stage
## 413   NA    3.23     NA       NA  NA   NA      312    10.8     3
## 414   NA    2.96     NA       NA  NA   NA      174    10.9     3
## 415   NA    3.83     NA       NA  NA   NA      180    11.2     4
## 416   NA    3.42     NA       NA  NA   NA      143     9.9     3
## 417   NA    3.75     NA       NA  NA   NA      269    10.4     3
## 418   NA    3.29     NA       NA  NA   NA      350    10.6     4
pmod <- pbc[1:312,]
tail(pmod)
##      id time status trt      age sex ascites hepato spiders edema bili
## 307 307 1149      0   2 30.57358   f       0      0       0     0  0.8
## 308 308 1153      0   1 61.18275   f       0      1       0     0  0.4
## 309 309  994      0   2 58.29979   f       0      0       0     0  0.4
## 310 310  939      0   1 62.33265   f       0      0       0     0  1.7
## 311 311  839      0   1 37.99863   f       0      0       0     0  2.0
## 312 312  788      0   2 33.15264   f       0      0       1     0  6.4
##     chol albumin copper alk.phos ast trig platelet protime stage
## 307  273    3.56     52     1282 130   59      344    10.5     2
## 308  246    3.58     24      797  91  113      288    10.4     2
## 309  260    2.75     41     1166  70   82      231    10.8     2
## 310  434    3.35     39     1713 171  100      234    10.2     2
## 311  247    3.16     69     1050 117   88      335    10.5     2
## 312  576    3.79    186     2115 136  149      200    10.8     2
summary(pmodtime)
##    Min. 1st Qu.  Median    Mean 3rd Qu.    Max.
##      41    1191    1840    2006    2697    4556
table(pmodstatus)
##
##   0   1   2
## 168  19 125
p.surv <- Surv(pmodtime,pmod$status==2)
print(p.surv)
##   [1]  400  4500+ 1012  1925  1504+ 2503  1832+ 2466  2400    51  3762
##  [12]  304  3577+ 1217  3584  3672+  769   131  4232+ 1356  3445+  673
##  [23]  264  4079  4127+ 1444    77   549  4509+  321  3839  4523+ 3170
##  [34] 3933+ 2847  3611+  223  3244  2297  4467+ 1350  4453+ 4556+ 3428
##  [45] 4025+ 2256  2576+ 4427+  708  2598  3853  2386  1000  1434  1360
##  [56] 1847  3282  4459+ 2224  4365+ 4256+ 3090   859  1487  3992+ 4191
##  [67] 2769  4039+ 1170  3458+ 4196+ 4184+ 4190+ 1827  1191    71   326
##  [78] 1690  3707+  890  2540  3574  4050+ 4032+ 3358  1657   198  2452+
##  [89] 1741  2689   460   388  3913+  750   130  3850+  611  3823+ 3820+
## [100]  552  3581+ 3099+  110  3086  3092+ 3222  3388+ 2583  2504+ 2105
## [111] 2350+ 3445   980  3395  3422+ 3336+ 1083  2288   515  2033+  191
## [122] 3297+  971  3069+ 2468+  824  3255+ 1037  3239+ 1413   850  2944+
## [133] 2796  3149+ 3150+ 3098+ 2990+ 1297  2106+ 3059+ 3050+ 2419   786
## [144]  943  2976+ 2615+ 2995+ 1427   762  2891+ 2870+ 1152  2863+  140
## [155] 2666+  853  2835+ 2475+ 1536  2772+ 2797+  186  2055   264  1077
## [166] 2721+ 1682  2713+ 1212  2692+ 2574+ 2301+ 2657+ 2644+ 2624+ 1492
## [177] 2609+ 2580+ 2573+ 2563+ 2556+ 2555+ 2241+  974  2527+ 1576   733
## [188] 2332+ 2456+ 2504+  216  2443+  797  2449+ 2330+ 2363+ 2365+ 2357+
## [199] 1592+ 2318+ 2294+ 2272+ 2221+ 2090  2081  2255+ 2171+  904  2216+
## [210] 2224+ 2195+ 2176+ 2178+ 1786  1080  2168+  790  2170+ 2157+ 1235
## [221] 2050+  597   334  1945+ 2022+ 1978+  999  1967+  348  1979+ 1165
## [232] 1951+ 1932+ 1776+ 1882+ 1908+ 1882+ 1874+  694  1831+  837+ 1810+
## [243]  930  1690  1790+ 1435+  732+ 1785+ 1783+ 1769+ 1457+ 1770+ 1765+
## [254]  737+ 1735+ 1701+ 1614+ 1702+ 1615+ 1656+ 1677+ 1666+ 1301+ 1542+
## [265] 1084+ 1614+  179  1191  1363+ 1568+ 1569+ 1525+ 1558+ 1447+ 1349+
## [276] 1481+ 1434+ 1420+ 1433+ 1412+   41  1455+ 1030+ 1418+ 1401+ 1408+
## [287] 1234+ 1067+  799  1363+  901+ 1329+ 1320+ 1302+  877+ 1321+  533+
## [298] 1300+ 1293+  207  1295+ 1271+ 1250+ 1230+ 1216+ 1216+ 1149+ 1153+
## [309]  994+  939+  839+  788+
Run a simple Cox proportional hazards model
cox.mod1 <- coxph(p.surv~sex,data=pmod,na.action=na.omit)
print(cox.mod1)
## Call:
## coxph(formula = p.surv ~ sex
- data = pmod
- na.action = na.omit)
coef exp(coef) se(coef) z p
sexf -0.484 0.616 0.236 -2.05 0.041
Likelihood ratio test=3.77 on 1 df
- p=0.0521 n= 312
- number of events= 125
summary(cox.mod1)
## Call:
## coxph(formula = p.surv ~ sex
- data = pmod
- na.action = na.omit)
n= 312
- number of events= 125
coef exp(coef) se(coef) z Pr(>|z|)
sexf -0.4839 0.6164 0.2365 -2.046 0.0407 *
—
Signif. codes: 0 ‘’ 0.001 ‘’ 0.01 ‘’ 0.05 ‘.’ 0.1 ' ' 1
exp(coef) exp(-coef) lower .95 upper .95
sexf 0.6164 1.622 0.3877 0.9798
Concordance= 0.532 (se = 0.015 )
Rsquare= 0.012 (max possible= 0.983 )
Likelihood ratio test= 3.77 on 1 df
- p=0.05214
Wald test = 4.19 on 1 df
- p=0.04075
Score (logrank) test = 4.27 on 1 df
- p=0.03887
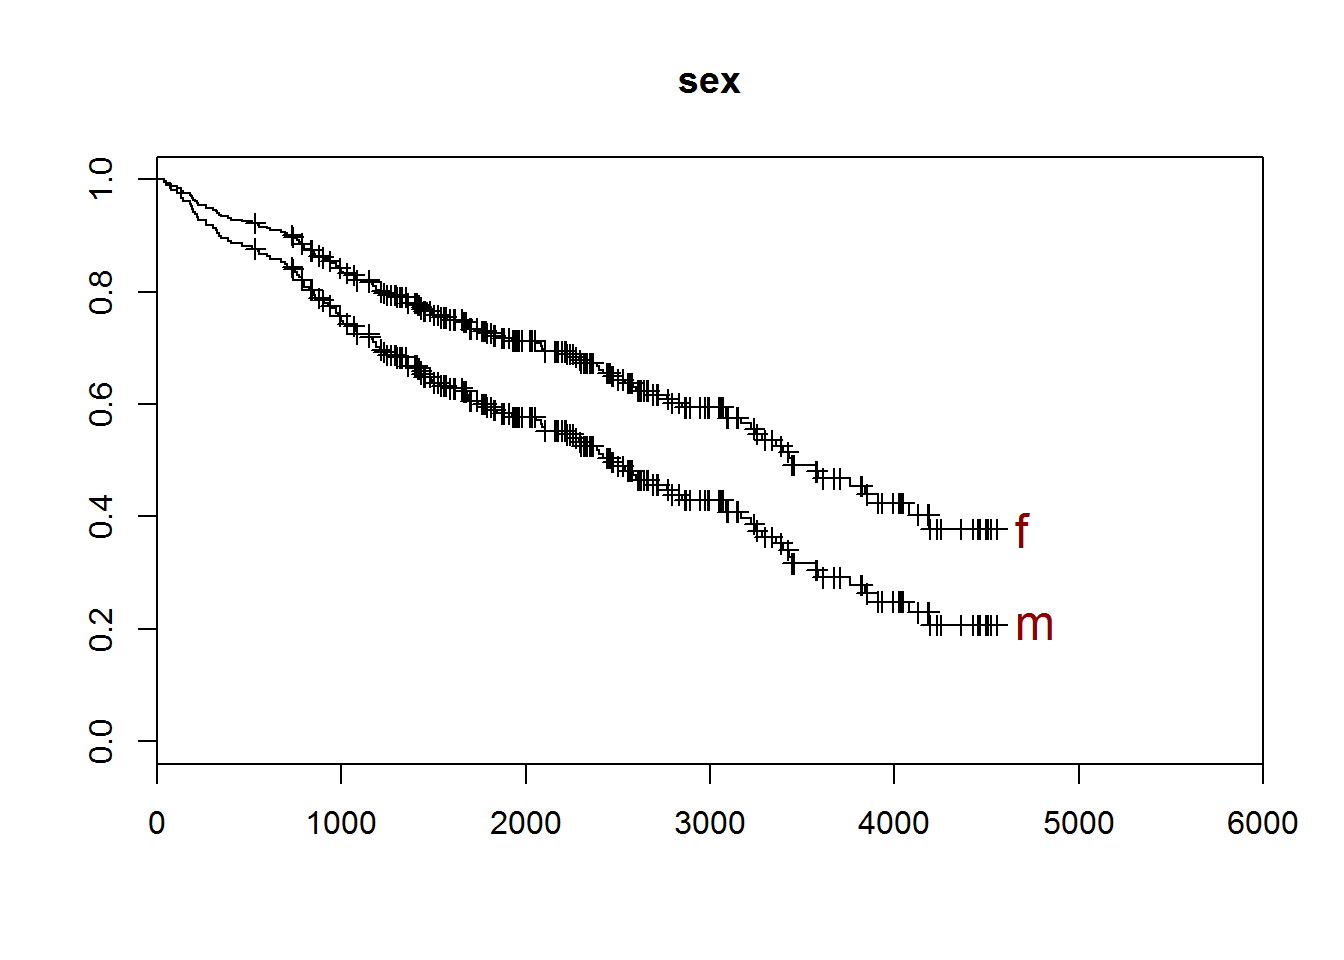
To plot the data
- you need to create predictions at the specific values of interest. With multiple indpendent variables
- any variable left out would be predicted at its average value.
pred.mod1 <- survfit(cox.mod1,newdata=data.frame(sex=c("f","m")))
plot(pred.mod1,xlim=c(0,6000))
title("sex")
end.pts <- dim(pred.mod1surv)[1]
end.x   <- rep(pred.mod1time[end.pts]+100,1)
end.y   <- pred.mod1surv[end.pts,]
end.nm  <- c("f","m")
text(end.x,end.y,end.nm,cex=1.5,col="darkred",adj=0)

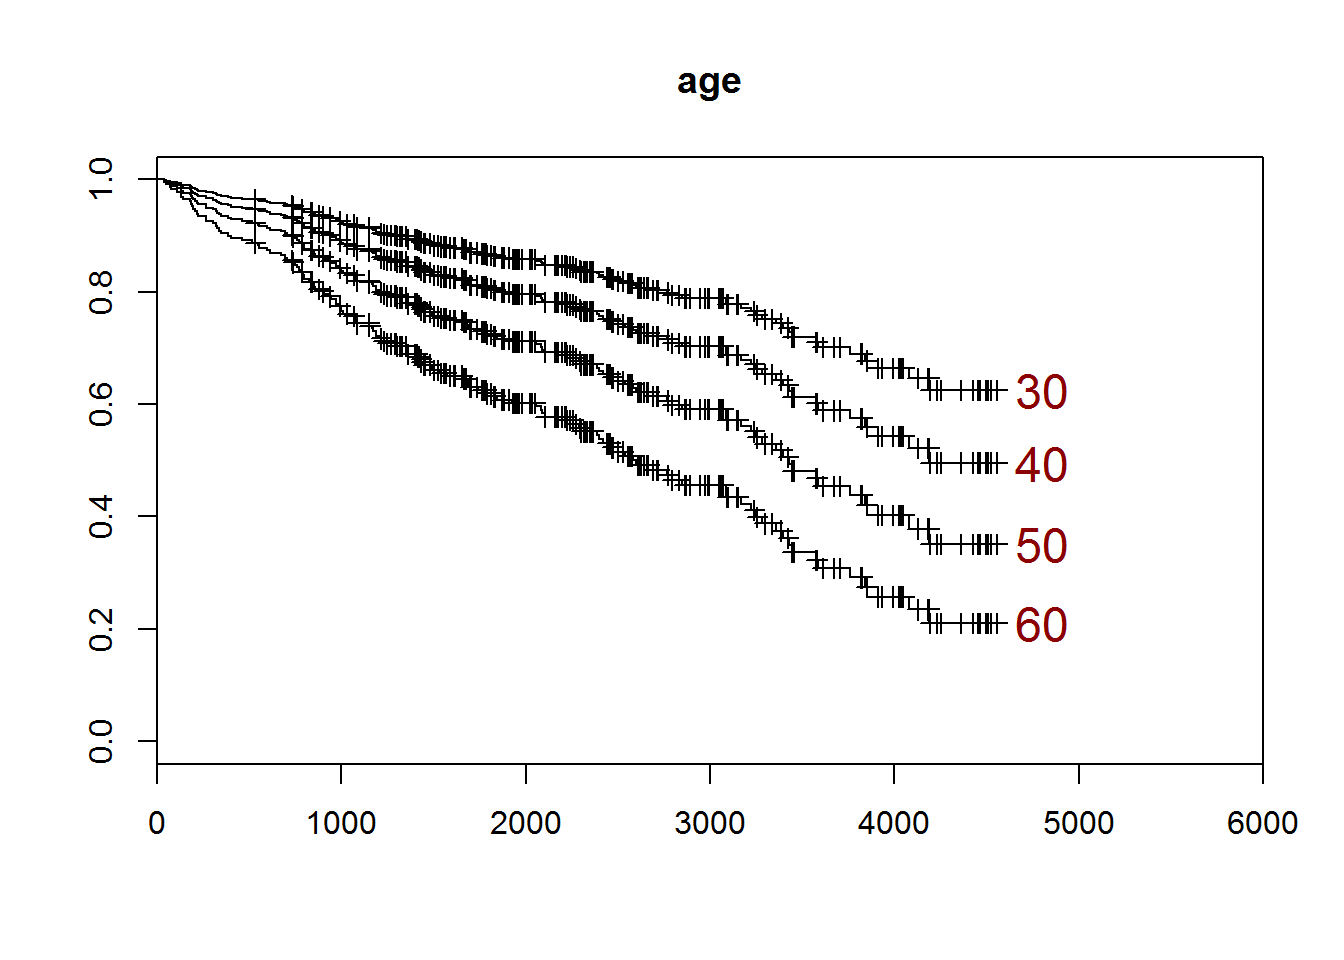
The Cox model works fairly similarly for continuous independent variables.
cox.mod1 <- coxph(p.surv~sex,data=pmod,na.action=na.omit)
print(cox.mod1)
## Call:
## coxph(formula = p.surv ~ sex
- data = pmod
- na.action = na.omit)
coef exp(coef) se(coef) z p
sexf -0.484 0.616 0.236 -2.05 0.041
Likelihood ratio test=3.77 on 1 df
- p=0.0521 n= 312
- number of events= 125
summary(cox.mod1)
## Call:
## coxph(formula = p.surv ~ sex
- data = pmod
- na.action = na.omit)
n= 312
- number of events= 125
coef exp(coef) se(coef) z Pr(>|z|)
sexf -0.4839 0.6164 0.2365 -2.046 0.0407 *
—
Signif. codes: 0 ‘’ 0.001 ‘’ 0.01 ‘’ 0.05 ‘.’ 0.1 ' ' 1
exp(coef) exp(-coef) lower .95 upper .95
sexf 0.6164 1.622 0.3877 0.9798
Concordance= 0.532 (se = 0.015 )
Rsquare= 0.012 (max possible= 0.983 )
Likelihood ratio test= 3.77 on 1 df
- p=0.05214
Wald test = 4.19 on 1 df
- p=0.04075
Score (logrank) test = 4.27 on 1 df
- p=0.03887
cox.mod2 <- coxph(p.surv~age,data=pmod,na.action=na.omit)
print(cox.mod2)
## Call:
## coxph(formula = p.surv ~ age
- data = pmod
- na.action = na.omit)
coef exp(coef) se(coef) z p
age 0.04 1.04 0.00881 4.54 5.7e-06
Likelihood ratio test=20.5 on 1 df
- p=5.95e-06 n= 312
- number of events= 125
summary(cox.mod2)
## Call:
## coxph(formula = p.surv ~ age
- data = pmod
- na.action = na.omit)
n= 312
- number of events= 125
coef exp(coef) se(coef) z Pr(>|z|)
age 0.039995 1.040806 0.008811 4.539 5.65e-06 ***
—
Signif. codes: 0 ‘’ 0.001 ‘’ 0.01 ‘’ 0.05 ‘.’ 0.1 ' ' 1
exp(coef) exp(-coef) lower .95 upper .95
age 1.041 0.9608 1.023 1.059
Concordance= 0.625 (se = 0.029 )
Rsquare= 0.064 (max possible= 0.983 )
Likelihood ratio test= 20.51 on 1 df
- p=5.947e-06
Wald test = 20.6 on 1 df
- p=5.651e-06
Score (logrank) test = 20.86 on 1 df
- p=4.942e-06
pred.mod2 <- survfit(cox.mod2,newdata=data.frame(age=c(30,40,50,60)))
plot(pred.mod2,xlim=c(0,6000))
title("age")
end.pts <- dim(pred.mod2surv)[1]
end.x   <- pred.mod2time[end.pts]+100
end.y   <- pred.mod2surv[end.pts,]
end.nm  <- c(30,40,50,60)
text(end.x,end.y,end.nm,cex=1.5,col="darkred",adj=0)

You can find an earlier version of this page on my blog.