Who am I?
Steve Simon
- PhD Statistics, 1982, U Iowa
- Teach in Biomedical and Health Informatics
- Previous jobs at CMH, CDC
- Part-time independent statistical consultant (P.Mean Consulting)
- Married to a Pediatric Cardiologist (retired)
- Run 5K and 4 mile races
Let me introduce myself. I am Steve Simon. I got a PhD in Statistics almost 40 years ago from the University of Iowa. The world has changed a lot since then, but I have tried to keep up. Today, if you want to sound trendy, you are a “data scientist”. I teach in the Department of Biomedical and Health Informatics at UMKC. I have had previous jobs at Children’s mercy Hospital, and the Centers for Disease Control and Prevention. I’m also a part-time statistical consultant. I have a sole proprietorship, P.Mean Consulting. That’s short for Professor Mean. For people who don’t get the joke, I point out that Professor Mean is not just your average Professor. Related to this talk, I should point out that I am obsessed with computers.
Obsessed with computers since 1972
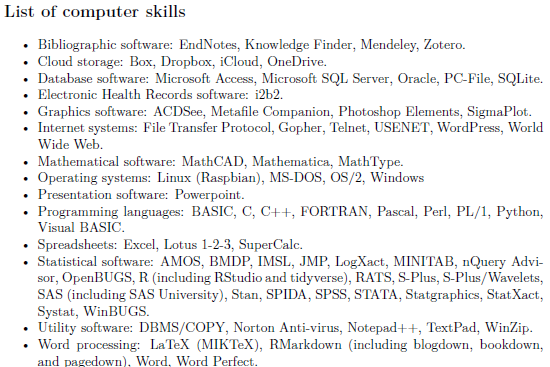
Figure 1. Section on computer skills from my resume
I should add that I am a bit of a computer geek. Here’s a list of computer skills that I put on my resume. I deliberately made this too small to read so that you wouldn’t recognize that half of the computer skills I mention have been obsolete for several deades. The computers I used in the 1970s were nothing like today’s computers.
Worked with health care applications since 1987
- Recent positions
- Centers for Disease Control and Prevention (1987-1996)
- Children’s Mercy Hospital (1996-2008)
- UMKC School of Medicine (2008 to present)
- But…
- I am not a doctor
- Still confused about many things
- Example: Difference between good and bad cholesterol.
I’ve also been working with a variety of health care professionals for many decades. I have learned a lot along the way, but I am not a doctor. Not an MD doctor anyway. When I talk about medical examples, keep that in mind. I don’t always describe things accurately from a mdedical perspective, and I’m always forgetting which one is the bad cholesterol.
Is it ldl or hdl? Does anyone know?
First poll question
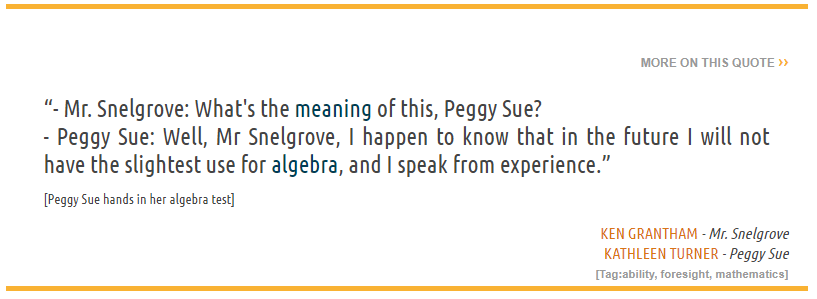
Figure 2. Quote from “Peggy Sue Got Married”
I want to get a quick feel for your background and interests. Here’s a quote from a romantic comedy starring Kathleen Turner from 1986. A forty year old woman, played by Kathleen Turner, travels back in time to her high school senior year, 1960. She has an amusing interchange with her high school math teacher.
“I happend to know that in the future, I will not have the slightest use for algebra, and I speak from experience.”
Think back to your high school algebra class.
Do you remember any important formulas from that class?
Did you hate, hate, hate high school algebra?
Did you love high school algebra?
Big question: Will you use high school algebra in your future?
Source: https://www.moviequotes.com/s-movie/peggy-sue-got-married/
Second poll question

Figure 3. Images of various computers
How many of these computational devices have you used?
- Laptop computer
- Desktop computer
- Tablet computer
- Smart phone
- Gaming console
- Smart watch
Big question: What impact does the current generation’s immersion of computing have on society?
Images found at
https://commons.wikimedia.org/wiki/File:Black_laptop_computer_open_frontal.svg https://www.pcmag.com/picks/the-best-desktop-computers https://www.cleverfiles.com/howto/what-is-tablet-computer.html https://www.theverge.com/21420196/best-budget-smartphone-cheap https://www.vulture.com/article/best-video-game-console-2020-ps5-xbox-series-x-nintendo-switch.html https://www.homernews.com/marketplace/fitnus-smartwatch-review-legit-fitness-tracker-smart-watch/
Are Statisticians Gods?
I’m helping someone who wants an alternative statistical analysis to the one used by the principal investigator. I’m happy to help and will offer advice about why my approach may be better, but I was warned that the PI considers the analysis chosen to be ordained by the “Statistical Gods” at her place of work.
True story. I was asked to review a report from a federal agency, but was warned that negative comments, even if accurate, might not be well received because the agency’s work was ordained by their Statistic Gods. At first, I thought this was amusing. If I could get the title of “Statistical God”, I could double my hourly consulting rate. But deep down this story really bothered me. It implies that Statistical skills are supernatural, and only available to a select few special people. I learned Statistics through hard work, and you can learn Statistics through hard work also. Some people will learn it faster than others because they have good aptitudes in mathematics and programming. But there is nothing other than time to stop you.
The arrogance of empiricism (1/2)
“I often say that when you can measure what you are speaking about, and express it in numbers, you know something about it; but when you cannot measure it, when you cannot express it in numbers, your knowledge is of a meagre and unsatisfactory kind; it may be the beginning of knowledge, but you have scarcely in your thoughts advanced to the state of Science, whatever the matter may be.” Lord Kelvin.
The idea that Statistics are a social construction flies in the face of empiricism, the philosophy that experiments can reveal the realities of the world.
Here is a quote in support of empiricism. I won’t read all of the first quote, but notice the sneering phrase that without numbers, “your knowledge is of a meagre and unsatisfactory and unsatisfactory kind.”
The arrogance of empiricism (2/2)
“No human investigation can be called real science if it cannot be demonstrated mathematically.” Leonardo da Vinci
Here is a second quote that is just as bad. Science without numbers (math) is not real.
Why empiricism fails (1/3)
“The government is very keen on amassing statistics. They collect them, add them, raise them to the nth power, take the cube root and prepare wonderful diagrams. But you must never forget that every one of these figures comes in the first instance from the village watchman, who just puts down what he damn well pleases.” Sir Josiah Stamp
This quote from Josiah Stamp illustrates why Statistics are a social construct. It doesn’t matter how fancy we dress up the numbers, nth powers, cube roots. It all comes down to the village watchman who does what he damn well pleases.
The village watchman is part of the social constuction of Statistics. So are the government officials who do all sorts of mathematical manpulations which provide an impression of objectivity.
Why empricism fails (2/3)
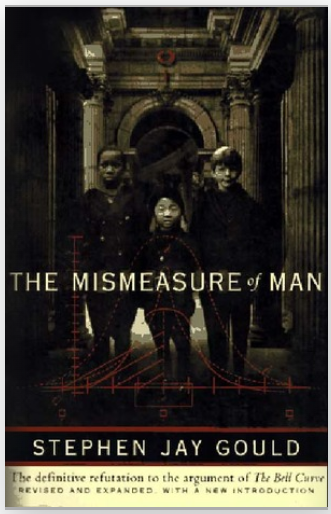
Figure 5. Cover of Stephen Jay Gould’s book
There’s a great book by Stephen Jay Gould that really makes you think hard about numbers. The book, The Mismeasure of Man, talks about IQ testing from a historical perspective and totally destroys the idea that intelligence is a trair that can be easily quantified. He starts with efforts in the 1800s to use the size of a person’s skull as a measure of their intelligence. A big skull means a big brain that lives inside there and bigger brains are smarter brains.
Why empricism fails (3/3)

Figure 6. Frame from Yes, Prime Minister video clip
This short video clip is an excellent illustration of how the questions leading up to a particular question on a survey can bias the response to that survey. It comes from a British comedy, Yes Prime Minister, that ran in the 1980s.
YouTube. Leading Questions - Yes Prime Minister. Taken from the 1st Season of Yes Prime Minister, Episode 2, The Ministerial Broadcast. 2:16 running time. Published on Jan 15, 2012.
But numbers still have value. Example: Quality of Life
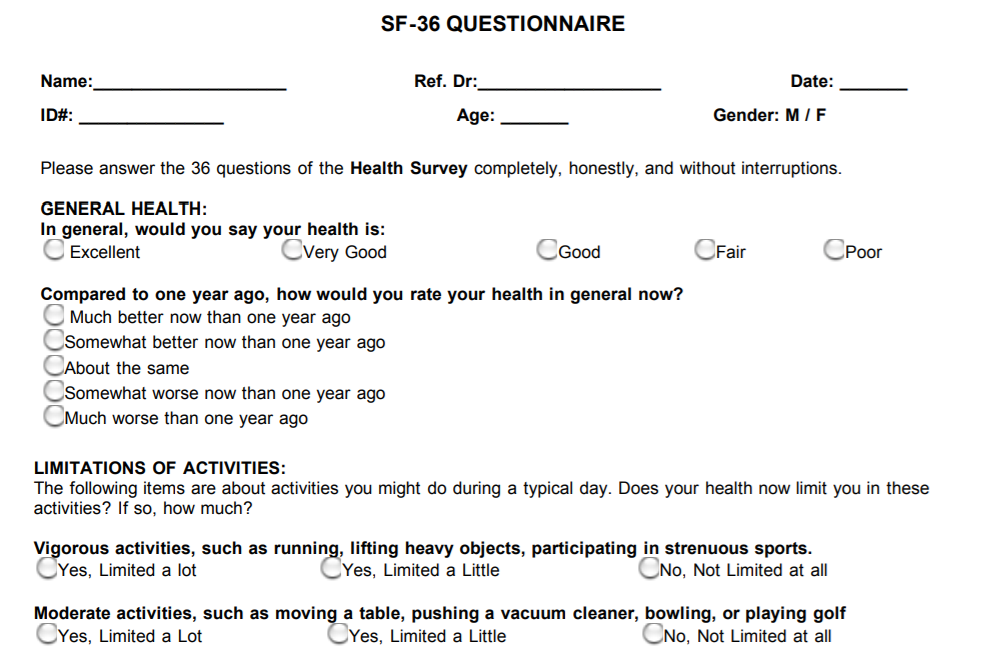
Figure 7. First few questions from SF-36 form
Recognizing that Statistics are a social construction does not mean that Statistics are worthless and that experiments are a waste of time. The best example I can give for this is the measure of quality of life.
Quality of Life is a measure that is reported in many research studies. There is no question that quality of life is a social construction. It is measured by forms like the SF-36 shown here. But it is not an objective reality but something that was constructed by humans.
Now I mentioned earlier that I like to run. It is a pretty strenuous activity, but one that I enjoy. A friend of mine said, though, that she couldn’t understand why you would want to run, unless you were being chased. One the other hand, I would not miss a thing if I did not push a vacuum.
There is no objective measure of quality of life. It depends on the values of the people who are developing forms like the SF-36.
Problems occur when these social constructs are developed by research teams with limited diversity (they may have blind spots) or if the social constructs are not evaluated in diverse populations.
But we can still use social constructs like quality of life, as long as we do it carefully.
In fact, we should use these measures because they get at information which is important, and which cannot be measured by a laboratory.
There’s a lot of uncertainty about treatments for cancer, for example, which can sometimes extend a person’s lifetime, but can also substantially interfere with their ability to do things that they feel are important. You can’t discuss this trade-off without first measuring the deterioration of quality of life associated with some of these aggressive therapies.
Image obtained from
https://clinmedjournals.org/articles/jmdt/jmdt-2-023-figure-1.pdf
Things have gotten worse, thanks to big data
Large amounts of data of uneven quality
Black box models
Lack of accountability
Scaling problems
Loss of privacy
Now everything I’ve mentioned so far is a problem in Statistics that has been around since before I was born. But we are in a new era, the era of big data. We have data today at a size and a level of detail that was unavailable twenty years ago. This is thanks to the internet, the human genome project, and many other things.
I’m glad we have all these data, because it increases the opportunities for learning. But at the same time, the flaws of empiricism have gotten worse.
Part of the problem is that the massive data sets that we use today have a great unevenness of quality. it is not too hard to identify obvious typos in a data set with a few hundred observations, but you would never been able to spot them in a data set with a few million observations.
Second, big data requires more complex data analysis methods and these methods are often difficult to understand. Not just from a how do these new methods work, but also in what aspects of the data are emphasized and what aspects of the data are ignored. A small model that has ten inputs is easily taken apart and examined, but you can’t do that with a model that has ten thousand inputs.
Third, there is a lack of accountability. These complex models are rarely audited, for example, to look for hidden biases.
Fourth, big data provides an opportunity to produce answers not just for a small number of people, but for thousands or millions of them all at once. If the big data model is flawed, the flaws are multiplied across the large number of people who are affected by the big data model.
Fifth, there is so much data out there that you can often infer quite intimate and private details about individuals, often without them being aware of this.
Small group exercises
- Form groups of 4-5 people.
- Answer the following questions
- Who is the villain?
- Who is the victim?
- How was the victim harmed?
- What could have prevented this?
- Did anything surprise you?
- Did you disagree with anything in the article?
- Is there a single quote from the article that summarizes it well?
I want to do a small group exercise where you look at a newspaper article that discusses harm that occurred thanks to computer models. Do this in groups of 4 to 5 people. Read the article quicly. It should not take more than 5 minutes to read. Then designate someone as a note taker and a different individual as the spokesperson for the group. Come up with answers for the questions listed here.
Given the size of the class, we may not have the opportunity to let every group speak, but I will try to spread things around as much as possible.
Weapons of Math Destruction
Figure 8. Cover of Cathy O’Neill’s book
I want to discuss one example in detail. It comes from chapter 1 of the book, Weapons of Math Destruction, by Cathy O’Neil.
First villain
- Walter Quijano
- Provided testimony on recidivism rates at seven trials
- Unfairly included race in his calculations and testimony
- Six of seven convictions later overturned
The big data example in O’Neil’s book starts with the story of a person, Walter Quijano, who provided testimony in seven trials about the risk of recidivism. Recidivism is the unfortunate even where someone who has been released from prison commits a new crime and gets tossed back in jail. Mr. Quijano gave overtly biased recommendations at these trials that incorporated race into his assessment of recidivism. This was noted in the appeals of one of the defendants, and led to six of the seven convictions being overturned.
Second villain
- LSI-R questionnaire
- Given to thousands of inmates
- Classifies risk of recidivism
- Does not explicitly ask about race
- But does have “leading” questions
It contrasts this individual with a big data prediction model based on the LSI-R questionnaire. LSI-R stands for Level of Service Inventory-Revised that asks a bunch of questions like “How many prior convictions have you had?” This questionnaire weights the responses to various questions to provide an estimate of the risk of recidivism. Although the questionnaire does not explicitly ask about race, it can still indirectly identify a person’s race by their pattern of responses to a series of leading questions.
Victims
- Inmates at parole hearings
- Defendants at trial sentencing
This questionnaire was used at a large number of parole hearings in multiple states and at sentencing hearings in a few states as well.
How were the victims harmed
- Disproportionate recidivism risks by race
- Fewer paroles grants
- Longer sentences
- No avenue to appeal
- Model presumed to be unbiased
- Complexity prevents examination of bias
- Scale issues
- Walter Quijano harmed 7 defendants
- LSI-R harmed thousands of defendants.
The model was shown to grossly overstate the recidivism risk of black defendants. This led to fewer grants of parole to black prisoners and longer prison sentences for newly convicted black defendants.
There was no avenue of appeal for those harmed by the LSI-R. You can’t cross-examine an algorithm at trial, and the company that developed the LSI-R model did not want to disclose details about how the model worked. It was a trade secret and revealing its details would allow other companies to steal their technology. To be honest, the model itself was so complex that the company would have been unable to reveal its inner workings, even if it wanted to.
The other important is issue is the scale of the harm. A biased witness could only influece a handful of defendants. This algorithm, however, was applied to many people. Walter Quijano had only enough time and energy to taint the sentencing of seven defendants, but the impact of the LSI-R questionnaire ended up influencing thousands.
That’s a hallmark of big data models. They are expensive to build and very labor intensive, but once they are built, it costs almost nothing to deploy it broadly.
What could have prevented this
- Insist on transparency
- Test the model for bias
- Build the model with better objective
Did anything surprise you?
- Questionnaire includes questions that would be inadmissable if they were asked during a normal trial
- When was the first time you were ever involved with the police?
- Do any of your friends or relatives have a criminal record?
I read about this a couple of years ago, but I think the thing that surprised me was the number of questions on the LSI-R that would not have been allowed in an open trial, because the questions would have been ruled as prejudicial.
But apparently, you can ask prejudicial questions outside of a courtroom in a questionnaire and then use that information to create a recidivism risk score.
Did you disagree with anything in the article?
- No
Is there are single quote that summarizes the article well
“The questionnaire includes circumstances of a criminal’s birth and upbringing, including his or her family, neighborhood, and friends. These details should not be relevant to a criminal case or to the sentencing.”
A Face Is Exposed for AOL Searcher No. 4417749
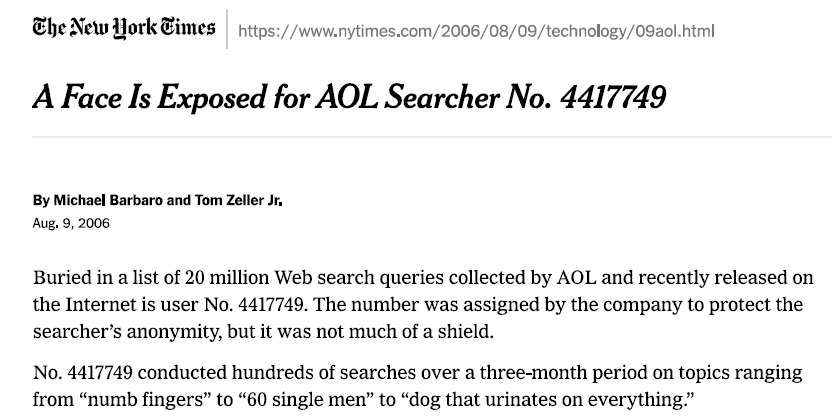
Figure 9. First page of newspaper article
How a ‘NULL’ License Plate Landed One Hacker in Ticket Hell

Figure 10. First page of newspaper article
How Bright Promise in Cancer Testing Fell Apart
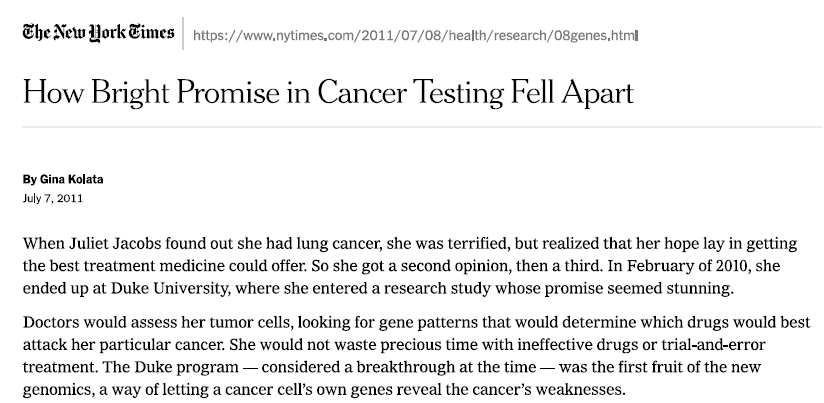
Figure 11. First page of newspaper article
Myths about big data
Algorithms are objective
If you have enough data, quality is no longer an issue
We are getting better at this
If there are any big lessons from this, they are that you should be skeptical about big data. Algorithms are not objective. They are a social construct. Also, don’t believe that bigger datasets are always better. A lot of data does not compensate for poor quality. Finally, while I am a big believer in progress, I think that too many of us are making mistakes and those mistakes are a lot worse when the data is big.
No single cause of these problems
wrong data
Wrong objective
Wrong deployment
Wrong team
There is no single cause for these problems. They are built into the system and it takes a lot of effort to work these biases out of the system.
On the next couple of slides, I want to show a classic Venn diagram and my variation on it to illustrate an important point.
Here’s a classic Venn diagram that you will see in pretty much any article that talks about big data or data science (I use those words interchangeably).
There are three areas of expertise that you need as a data scientist: knowledge of mathematics and statistics, skill with computer science and coding, and expertise in medical or scientific specialties.
A more accurate picture would show that there is not enough overlap among these disciplines.Not that many people are skilled at both science and statistics. Fewer stil know both of those skills well and can program effectively.
That’s actually good news from your perspective. You don’t have to be a genius in all three areas. Be good in one area and have an appreciation of the the other two and you’ll do just fine.
What they say data science is

What data science really is

Why you are needed
- Too many geeks, not enough scientists
- More racial, gender diversity is needed
If you are interested, email me: simons@umkc.edu
I’d like to end with an exhortation. We need people like you in data science. It’s okay to spend most of your time learning the complexities of medicine, but some of you have a bit of talent and aptitude in math/stat and in computers/coding. That’s an advantage your generation has that my generation did not. So you have the ability to appreciate the full picture more so than people my age. A few of us knew computers well, but today’s generation is saturated in computational experience.
Second, these research teams need a lot more racial and gender diversity. I try really hard to appreciate the viewpoints of people different than me, bit I can’t understand it at a level of someone who has seen life from a different perspective. If the only people developing these data science models are white males, then the models will continue to be biased against women and minorities.
