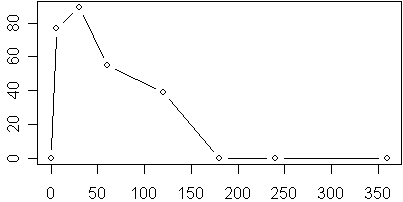
I was presented with a data set of sixteen subjects that showed a rise in values from zero to a maximum followed by gradual return of those values to zero for each subject. Here is the data for one of these subjects.
Data of this form can often be modeled by a difference of exponential functions. The formula is

where a, b, and c are constants that determine the shape of the function. The constant c determines how quickly the curve rises. For now, let’s set A=80 and b=0. For a large value of c (1/10), the curve rises rapidly, and for a small value (1/100) it rises slowly.
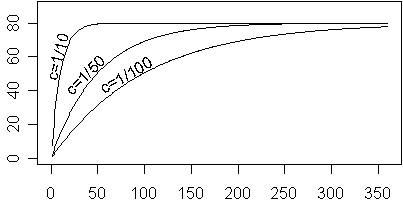
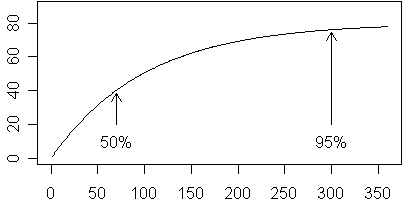
For any value of c, the curve rises to about 50% of the maximum value at 0.7/c and to about 95% of the maximum value at 3/c. For c=1/100, these values are 70 and 300, respectively.
The value of b controls how rapidly the curve falls back towards zero.
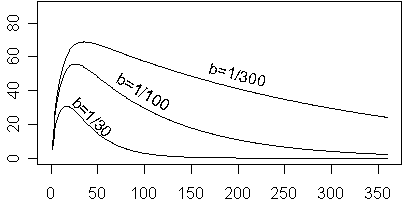
For any value of b, the curve falls to about 50% of the maximum after 0.7/b additional time units beyond the peak time, and falls to only 5% of the maximum after 3/b additional time units beyond the peak time. In the curve below (a=80, b=1/100, c=1/10), the maximum occurs at roughly t=25. The curve declines to 50% of the maximum approximately 0.7/b=70 units later or roughly t=95. The curve declines to only 5% of the maximum at 3/b=300 units past the maximum or roughly t=325.
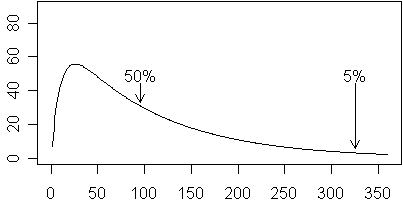
The value of a represents the “potential” maximum. It is a maximum that is reached if c is much larger than the b, but when b gets close to c, the actual maximum might be quite a bit less than the actual maximum.
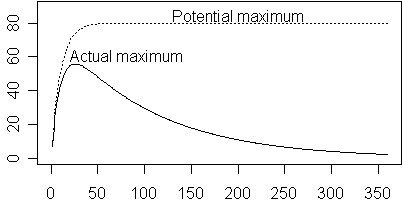
So how would you fit a difference of exponential distributions to the curve shown above? First, you need a ballpark estimate of the starting values. The curve rises to its maximum at about t=30, so a value of c=1/10 seems reasonable. It drops about halfway down around t=100, which is 70 time units beyond the maximum, so b=1/100 is possible. The actual maximum is 90, and the two values for b and c are an order of magnitude apart, so it might be reasonable to start with a=90.
Here is part of the output from SPSS:
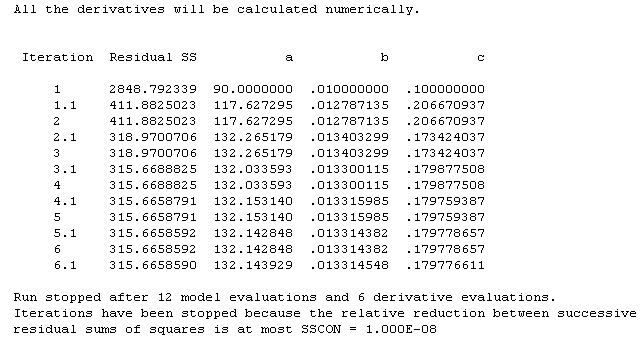
Notice that SPSS on its very first step made large increases in a and c. The increase in a is not too surprising because a represents the potential rather than the observed maximum. The increase in c represents the fact that the time to reach 95% of the actual maximum is actually faster than the time that it takes to reach the potential maximum. So I’ve learned that it can be easy to underestimate the proper values for a and c. Another problem is that the maximum actually occurs between two of the data points, as you can see from the graph shown below.
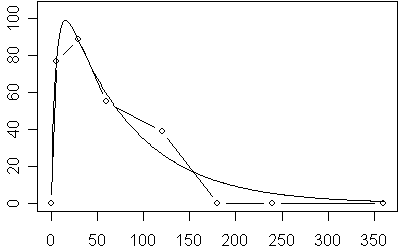
Getting perfect initial estimates is not all that critical. If you are anywhere close to the correct values, the procedure will converge properly. Problems do occur when you start with wildly unrealistic values, so you do need to put some thought into this.
You can find an earlier version of this page on my old website.