If you provide justification for a proposed sample size, you should include enough information to allow others to reproduce your calculations. Here is a brief overview of what you need to include.
Before I describe the information you should provide, I should note that often these numbers are “soft”. There are often no precise values that you can use because you are hoping that the data you collect will behave as you expect. If you use a standard deviation of 20, for example, in your sample size justification, and the data comes back with a standard deviation of 35, that’s just part of the research process. Give the best values you can, based on your knowledge of the science and based on what has happened in similar research studies in the past. No one will ask for a refund on the grant money they gave you if things are different from what you expected.
If you use the width of a confidence interval for a single mean to justify your sample size, report
- your confidence level (often 0.95),
- the desired width of your interval, and
- the standard deviation that you used.
If you use the width of a confidence interval for a single proportion to justify your sample size, report
- your confidence level (often 0.95),
- the desired width of your interval, and
- the proportion that you used.
If you use a power calculation for an independent samples t-test to justify your sample size, report
- your alpha level (often 0.05),
- whether you used a one sided or two sided test,
- your desired power (often 0.80 or 0.90),
- or equivalently your beta level (1-power),
- the minimum clinically important difference, and
- the standard deviation that you used.
Other scenarios for sample size justification would require different information. Here are a few examples of sample size justification. These are all fictional scenarios that I made up.
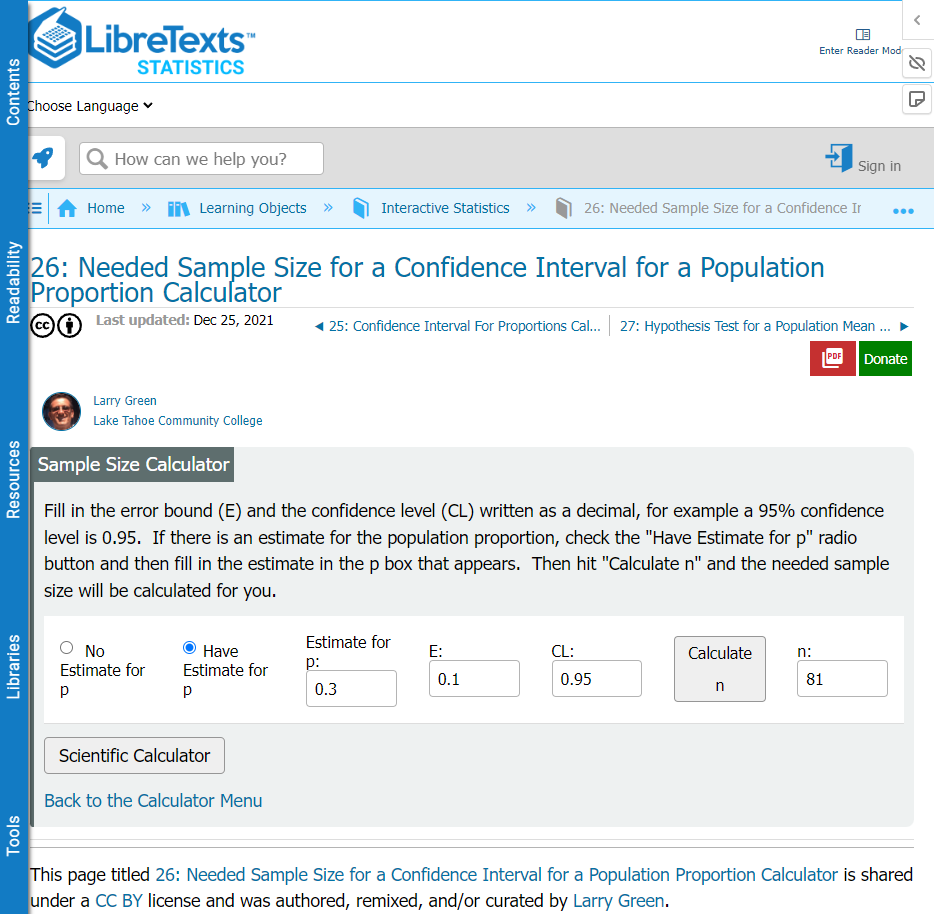
A primary goal of the pilot study is to estimate the proportion of subjects who discontinue therapy during the trial. A sample of 81 subjects would produce a 95% confidence interval for the discontinuation rate with a width of plus/minus 0.1, assuming that the proportion observed is around 0.3. Larger proportions would produce slightly less precision for the confidence intervals.
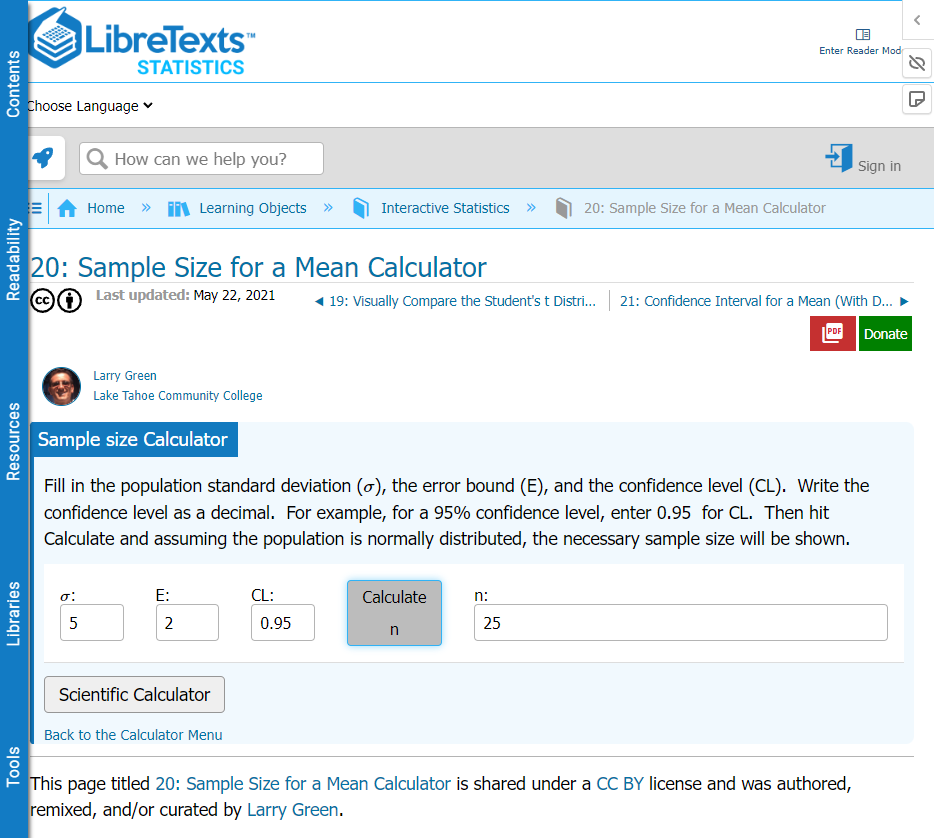
In addition to assessing safety and efficacy of a new skin barrier for burn victims, our research team wants to estimate the costs associated with this barrier. We estimate that a sample size of 25 patients would produce confidence intervals for the average cost with a width of plus or minus $2, assuming that the standard deviation of costs is $5.
The comparison of operation times between a standard incision versus laproscopic incision would require 275 patients per group. This is based on a presumed standard deviaiton of 40 minutes, a minimum clinically important difference of 10 minutes, 90% power, and a one-sided alpha level of 0.05.
The calculations for the first two scenarios used calculators from the free online text book, Interactive Statistics, by Larry Green. The calculation for the final scenario used SPSS. While you would not share the internal calculations in most reports, here are the screenshots that show the underlying sample size calculations.


