I was helping someone with power calculations for an animal experiment. There were several ways to estimate power and they all seemed to point to the use of either 8 animals per group or 12 animals per group. I explained that if she was more risk averse, she should use 12 animals and if she were more work averse, she should use 8 animals. Her answer surprised me a bit. She said that she liked the idea of using 12 animals per group. That way, if the results achieved significance after only 8 animals, she could go back to the Animal Care and Use Committee and tell that she saved a few animals.
This is an example of early stopping of a clinical trial (also described as an interim analysis). Generally, if you think you might want to stop a trial early, you should specify the conditions in your protocol prior to the start of data collection. Without such a rule, any examination of the data prior to the end of the study is a protocol deviation. As such, it should be reported to the IRB (if it is human research) or the ACUC (if it is animal research).
There are reasonable examples of why you might want to stop a study early even without planning ahead for such an event. For example, if a serious unexpected side effect appears, you might not want to offer the new drug to any more patients.
But stopping the study early (like any other protocol deviation) does reduce the credibility of the research findings, sometimes by a little bit, sometimes by a lot.
Here’s a little simulation that you can run in S-plus or R.
par(mar=c(4,5,0,0)+0.1,cex=2,pch="+")
f.p <- function(mua) {
  x1 <- rnorm(12)
  x2 <- mua+rnorm(12)
  p.value <- rep(NA,12)
  for (i in 2:12) {
    p.value[i] <- t.test(x1[1:i],x2[1:i])p.value
 }
 plot(p.value,type="b",ylim=0:1,cex=2)
 abline(h=0.05)
}
for (i in 1:100) {
  f.p(mua=1)
}
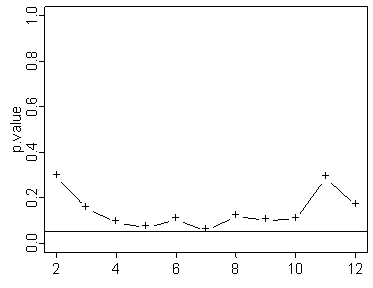
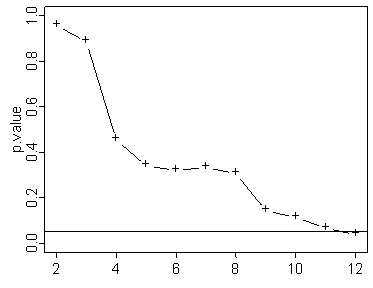
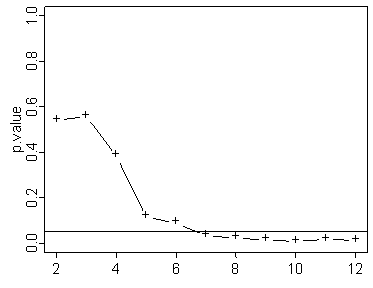
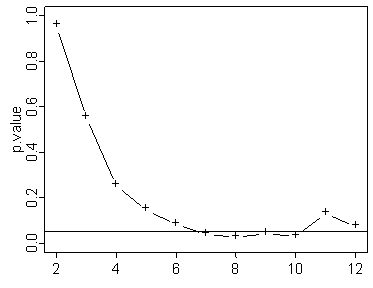
You’ll see a variety of different patterns for the p-values.

In the graph shown above the test never quite reaches statistical significance.

Here’s one where it just reaches statistical significance at the last sample.

Here’s one where it reaches statistical significance rather early. You would think that it would be nice to stop the experiment early here, but there is no guarantee that just because the p-value is below the significant level early on, that it will stay below that level the rest of the way.

Notice that the above graph shows statistical significance early, but then that significance disappears by the end of the experiment. Now this doesn’t happen very often. Out of 100 graphs only 4 or 5 showed this type of pattern. Most of the time if the p-value crosses below the 0.05 threshold early, it stays below that threshold. But these exceptions serve as a warning. If you stop the study early and make no adjustments to your p-value, your results may be invalid.
The adjustments to the p-value (and confidence interval) are rather complex. Here’s some more S-plus (R) code that shows some of the complexities of the situation. This program simulates an experiment with 12 animals per group, but looks at the p-value with after 4, 8, and 12 animals have been tested.
n <- 5000
p4 <- rep(NA,n)
p8 <- rep(NA,n)
p12 <- rep(NA,n)
for (i in 1:n) {
  x1 <- rnorm(12)
  x2 <- rnorm(12)
  p4[i] <- t.test(x1[1:4],x2[1:4])$p.value
  p8[i] <- t.test(x1[1:8],x2[1:8])$p.value
  p12[i] <- t.test(x1[1:12],x2[1:12])$p.value
}
sum(p4<0.05)/n
## [1] 0.0386
sum(p8<0.05)/n
## [1] 0.0518
sum(p12<0.05)/n
## [1] 0.048
sum(pmin(p4,p8,p12)<0.05)/n
## [1] 0.1002
Notice that each p-value considered in isolation maintains an alpha level of approximately 0.05. But when you combine the p-values and allow for statistical significance when either the n=4, n=8, or n=12 p-value achieves significance, the alpha level more than doubles.
Further reading:
Ludbrook J. Interim analyses of data as they accumulate in laboratory experimentation. BMC Med Res Methodol 2003: 3(1); 15. Available in html format or pdf format
- The Ludbrook reference points out that laboratory experiments often fail to account properly for early stopping (interim analysis) and suggests an approach for handling this properly.
You can find an earlier version of this page on my original website.