R sprouted from S
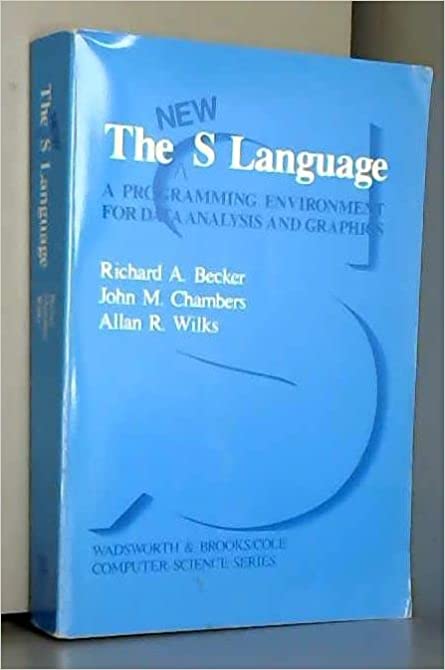
I’m helping to put together three separate classes, Basic data management and analysis with R, SAS, SPSS. As part of these classes, I need to discuss the history of these programs, because understanding that history will help you better understand the strengths and weaknesses of each statistical package. Here’s a brief history of R.
R has its roots in a program called S. S was developed in a time when single letters were in vogue (as in the C programming language).
Image source: Amazon
John Chambers

The primary author of the S language was John Chambers. Often he gets sole credit, there were two other major contributors.
Image source: [AT&T][att1]
Richard Becker

Also involved with S, is another statistician, Richard Becker.
Image source: [AT&T][att1]
Allan Wilks

A third author was Allan Wilks.
Image source: [AT&T][att1]
[att1]:http://stats.research.att.com/pics/jmc2.jpg, http://stats.research.att.com/history.php
Bell Labs
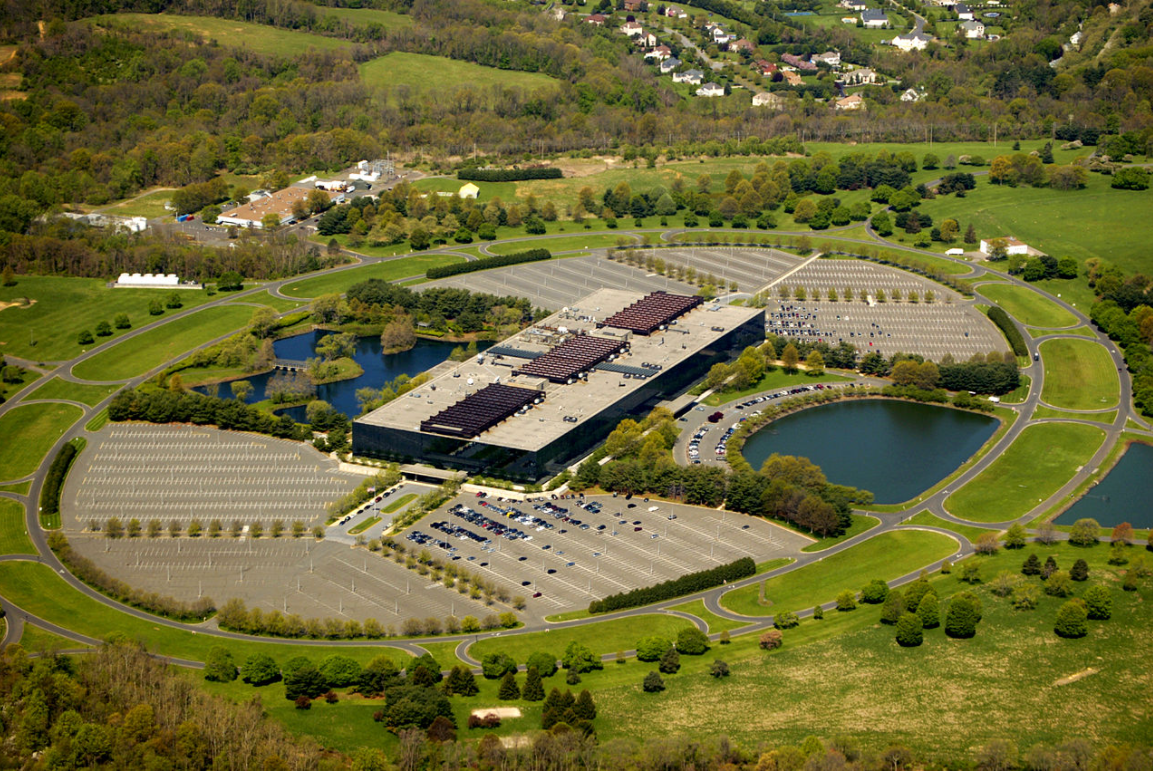
All three statisticians worked at Bell Labs. Bell Labs was a research division of AT&T (affectionately known as Ma Bell), back when Ma Bell held a monopoly over telephone service.
Image source: Wikipedia
Features of S.
- Intended for internal use.
- Freely available to anyone.
- Interactive
- Unique capabilities
- Emphasis on functions
- Object-oriented features
The author of S, John Chambers, was a statistician at Bell Laboratories wrote several versions in the 1970s through the 1990s. This packages was intended for internal research use, but the code was freely available to anyone who was interested.
S was an interactive programming language, which made it quite different from other statistical software systems of the times, like SAS and SPSS.
Two unique features of the S programming language were the use of functions rather than macros for extending the language and the introduction of object oriented features (classes, objects, and methods).
S-plus
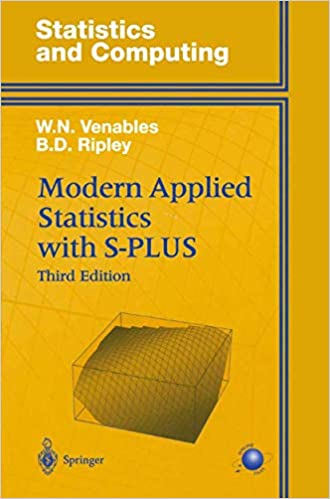
A commercial adaptation of S was introduced by Statistical Sciences Corporation in the 1990s and became very popular. Through various mergers and buyouts, S+ has been marketed by Mathsoft, Insightful Software, and more recently Tibco Corporation.
Image source: Amazon
Beginnings of R (1/2)
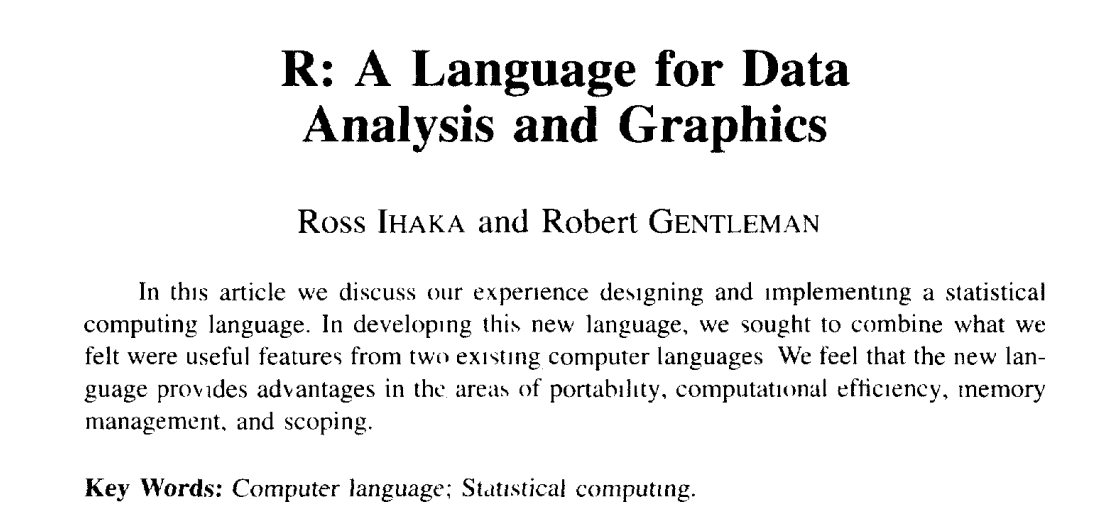
About the same time, Ross Ihaka and Robert Gentleman started an effort to produce an open source and freely distributed version of S, called R. Their publication:
Ross Ihaka and Robert Gentleman. R: A language for data analysis and graphics. Journal of Computational and Graphical Statistics, 5(3):299-314, 1996. Available in pdf format.
outlined the features of the R programming language.
Beginnings of R (2/2)
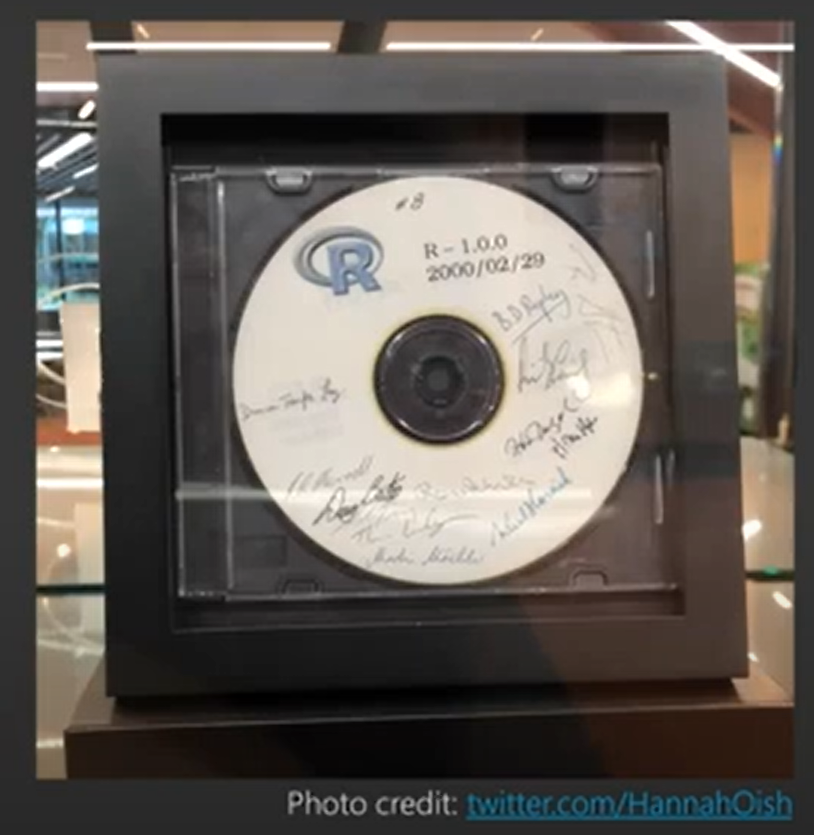
The first major release of R (version 1.0.0) appeared in 2000.
Growth in popularity
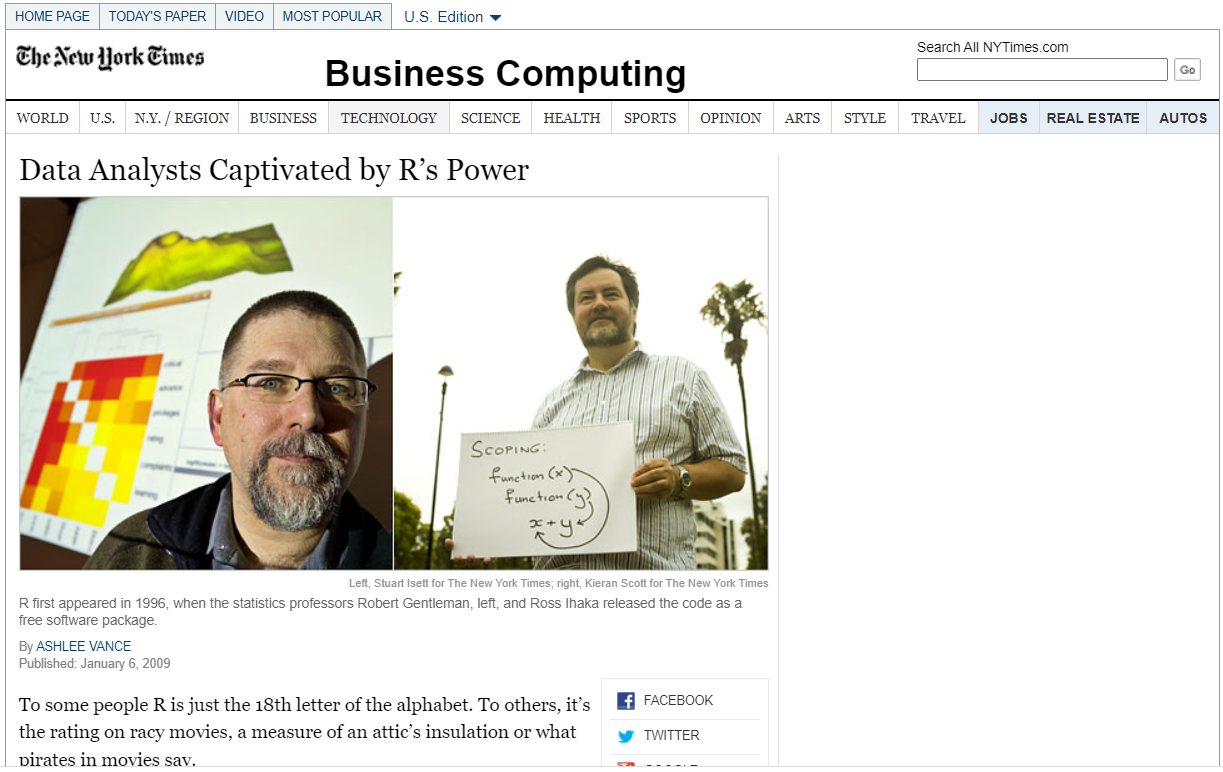
Soon R eclipsed S+ in popularity. One measure of the breadth of R’s impact was a New York Times article published in 2009.
Ashlee Vance. Data Analysts Captivated by R’s Power. The New York Times, 2009-01-06. Available in html format.
R Foundation
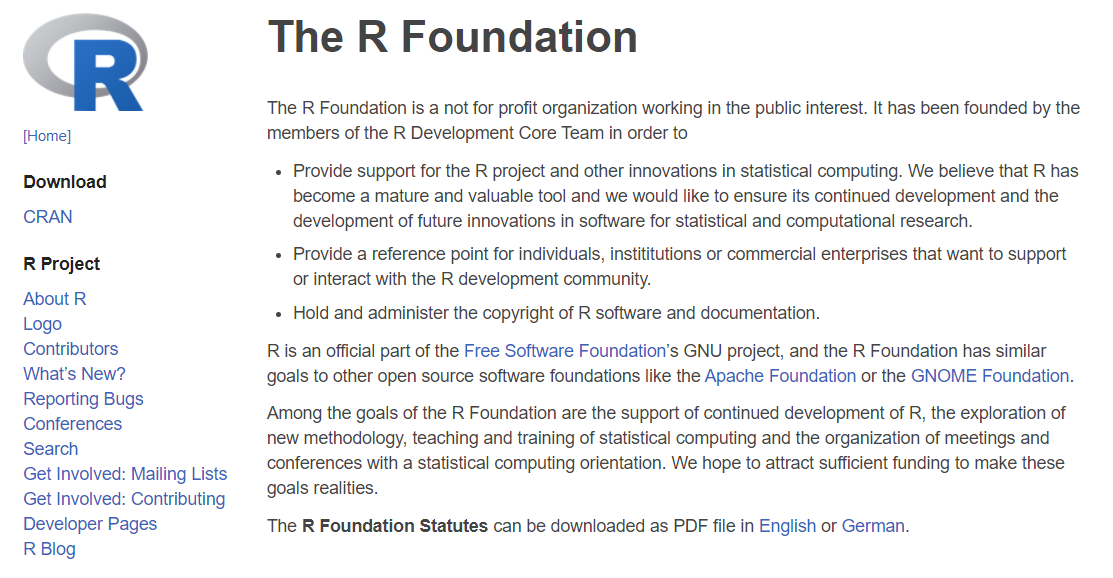
There is a non-profit group, the R Foundation for Statistical Computing, that coordinates many of the efforts in the maintenance and development of the R programming language.
Revolution Analytics

Several commercial companies have piggybacked on R, including Revolution Analytics, which sells an enhanced version of R with capabilities for handling very large data sets.
Image source: Dataversity
https://www.dataversity.net/microsoft-set-acquire-revolution-analytics/
R packages
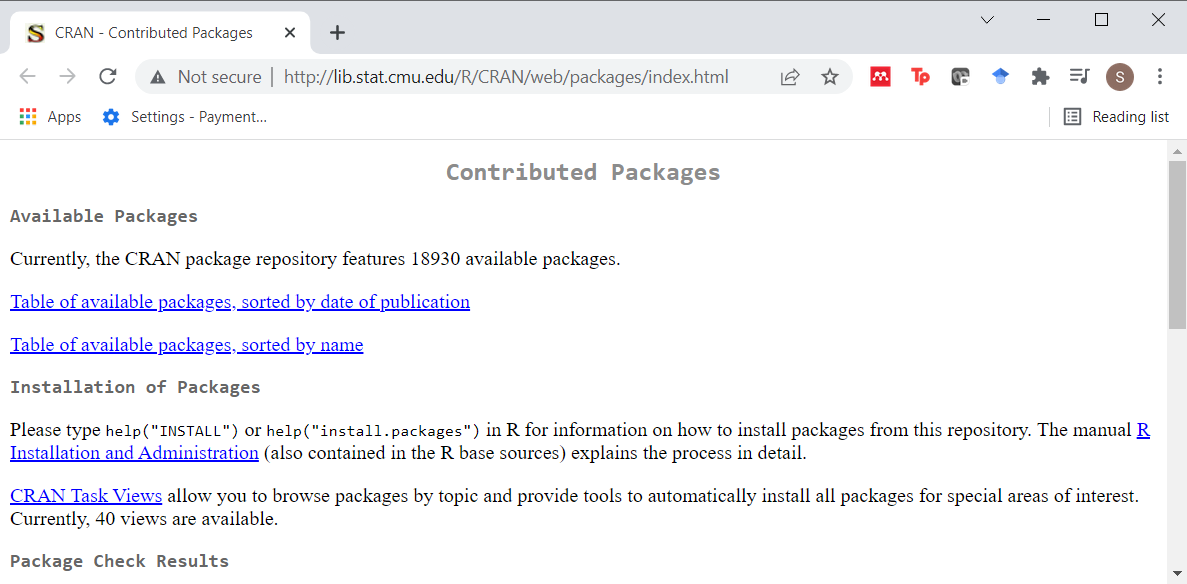
One of the most popular features of R is the ease with which outside developers can extend the R language through libraries. Most of these libraries are available for free under and open source license at the Comprehensive R Archive Network.
Bioconductor
You can also find a major effort to develop freely available libraries for statistical analysis of genetic data through the Bioconductor project.
BUGS
A lot of stand-along programs have leaned heavily on R to provide an interface to run their programs and process their outputs. Notable among these are a series of programs for Bayesian analysis, starting with BUGS. BUGS is an acronym for Bayes Using Gibbs Sampling. While it can be run by itself, it is a lot easier and more convenient to run it from inside R, and most applications of BUGS appear to use R. Other packages, jags (Just Another Gibbls Sampler), and Stan (named after the famous mathematician, Stan Ulam), also rely on R. It is worth noting that these programs are also easily run from Python.
Menu driven version of R
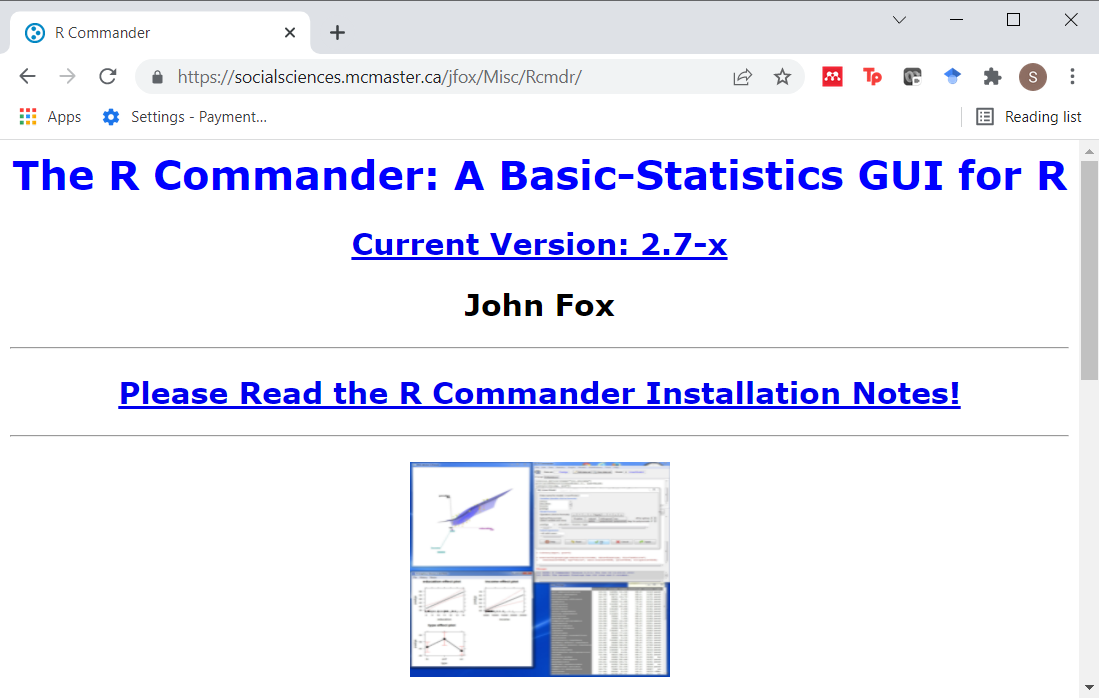
R is an interactive programming language, but menu driven versions of R are available. The most notable of these is R Commander
RStudio
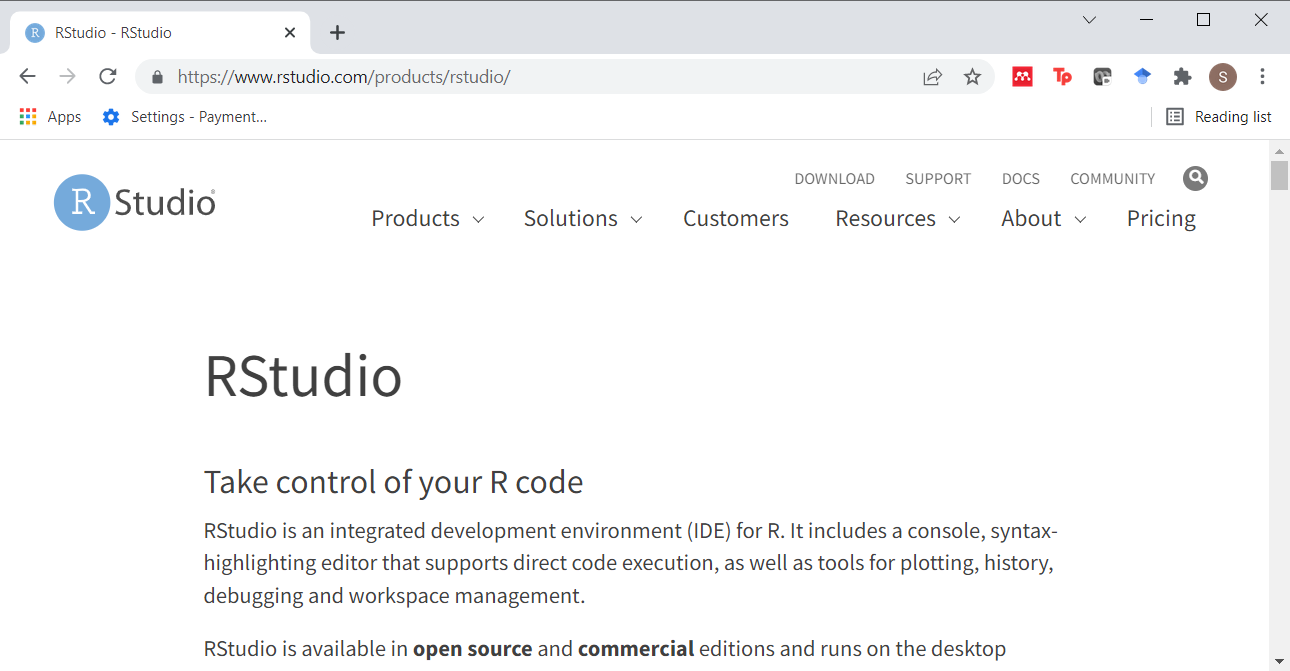
RStudio is an integrated development environment for R. The company that produces RStudio offers both free and commercial versions. They also employ many of the people listed below who have made major contributions to R.
Recent major contributions: Frank Harrell

Frank Harrell has produced a lot of advanced statistical models for R. This includes some extremely useful spline tools. His book, Regression Modeling Strategies, a classic text, uses R code throughout.
Image source: R-bloggers
Recent major contributions: Hadley Wickham

Hadley Wickham has written or co-written a large number of libraries in R that have refashioned R into almost a completely new programming language.
The tidyverse library

Originally, these packages were referred to collectively as the “Hadleyverse.” But Hadley Wickham discouraged that in favor of the name “tidyverse.”
The tidyverse package is a collection of several different packages which provide enhancements to the R programming language. These libraries share a common programming philosophy. There are several dozen libraries in total, but only a core set of libraries are loaded with the library(tidyverse) function. Other tidyverse packages must be loaded separately.
The tidyverse is a collection of packages for the R programming language developed by Hadley Wickham and others. I single out Hadley Wickham because he has been a major force behind the programming philosophy of the tidyverse and the lead author for many of the most important packages in the tidyverse.
The tidyverse packages embrace some guiding principles described in the tidyverse manifesto. The packages in the tidyverse encourage the use of tidy data. Tidy data is related to the database concept of normalization, though it is described from a statistical perspective (which means that an idiot like me can still understand it). The general concepts behind tidy data are described in a vignette and in a 2014 publication in the Journal of Statistical Software. The tidyverse research team has published a detailed guides on coding practices and program style that are consistent with their principles.
Here are some of the libraries in core set of libraries.
dplyr

dplyr provides a set of functions for data manipulation.
ggplot2

While R has some excellent graphics capabilities built in, they are somewhat difficult to use. The ggplot2 library simplifies the process of graphing by separating the parts of a graph into different layers. It is based on a conceptual framework developed by Leland Wilkinson in his book, The Grammar of Graphics.
magrittr

magrittr provides a pipe operator. The concept of the pipe was developed first in Unix systems almost 50 years ago. The pipe operator (percent-greater than-percent) takes input from the left side of the operator and feeds it to a function listed on the right side of the operator. Pipes can be chained together. They make your code simpler and more readable.
We may or may not cover pipes in this class.
readr

While R has many functions for reading text data, they are slow for very large files. The readr library reads text files much faster, offers some enhancements, and provides a simpler syntax.
stringr

stringr simplifies the manipulation of string or text data.
tibble

R has a variety of internal storage formats: arrays, lists, matrices, and data frames. We will focus mostly on data frames in this class. The tibble package offers an internal storage format, a tibble, that is very similar to a data frame, but it offers some extra features for convenience and simplicity.
tidyr

tidyr provides a series of functions that help with data manipulation, especially for longitudinal data.
Other packages in the tidyverse
- In the core package
- forcats
- purr
- Outside the core package
- broom
- lubridate
- readxl
- many others
Two other packages in the tidyverse core, forcats and purr, are for advanced applications.
Outside of the core package, some of the packages that I like are broom (which simplifies and standardizes the output from different data analysis functions) lubridate (which simplifies the manipulaton of dates), and readxl (which reads Microsoft Excel files). There are quite a few others.
Recent major contributions: Yihui Xie
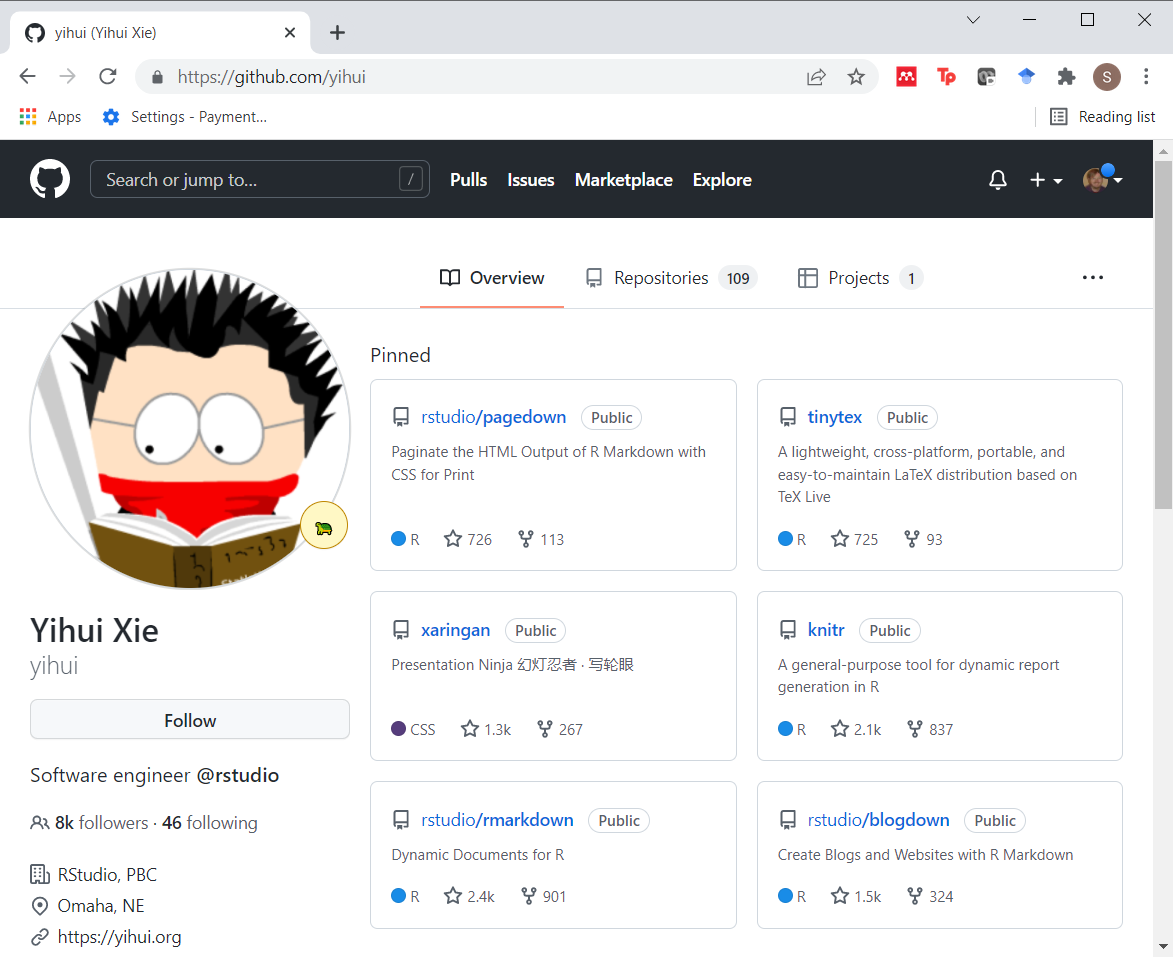
Another prolific contributor to R is Yihui Xie.
knitr

He wrote the package knitr back in 2012 that has revolutionized the field of reproducible research. knitr is an improvement on the package sweave. It takes R code, runs it and creates documents in a variety of formats using Pandoc.
bookdown

He wrote also wrote a package, bookdown, that has revolutionized the book publishing world. You can now write an entire book in R with the help of this package. It has publication ready graphics, tables, and formulas. It produces the table of contents, and an index. Over a thousand books have been produced using bookdown, including the definitive guide to bookdown itself, bookdown: Authoring Books and Technical Documents with R Markdown by Yihui Xie.
Other works by Yihui Xie
- blogdown
- tinytex
- xaringan
There are a lot more works by Yihui Xie that are worth discussing. blogdown uses R Markdown code to create a blog site. It is based on an open source web development system called Hugo. I am currently trying to convert my website (over 1,800 pages) to blogdown.
tinytex is an attempt to develop a minimal package for producing LaTex documents. It has all the features that you need to work with R Markdown, but does not include some of the extra features found in other versions of LaTex, that needlessly (in his opinion) add to the complexity of using LaTeX as part of R Markdown.
xaringan is a presentation format using html that offers an alternative to beamer and slidy.
If you want to learn more: Rickert 2014
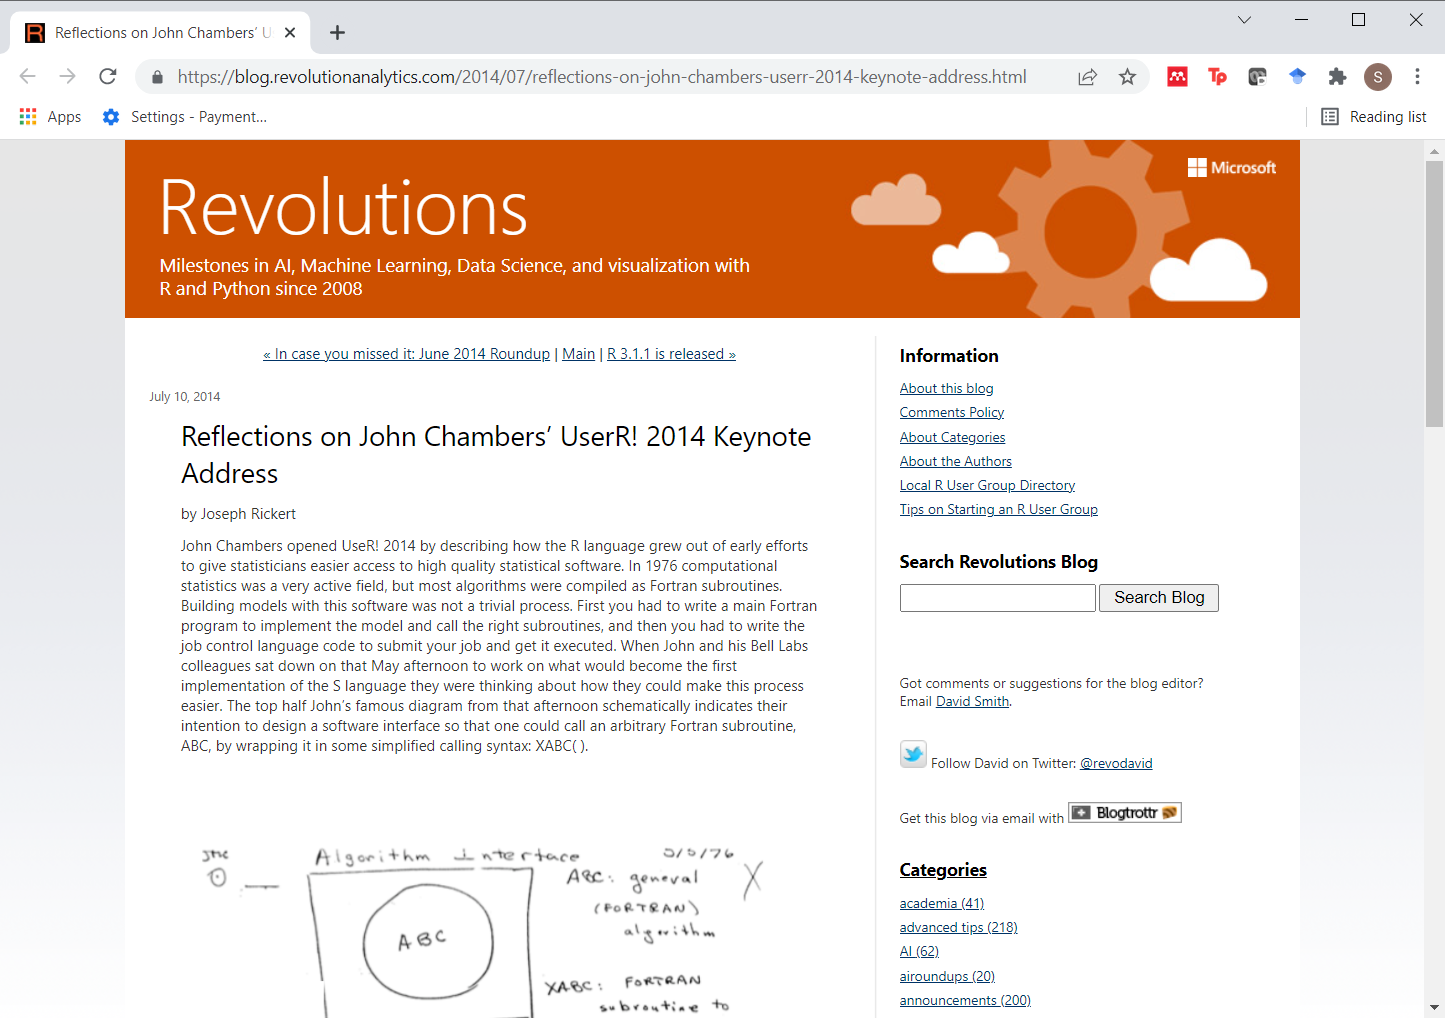
The Revolutions Analytic blog posted a [nice summary of a John Chambers talk on the history of S at the Use R! 2014 conference
If you want to learn more: Chambers 2006
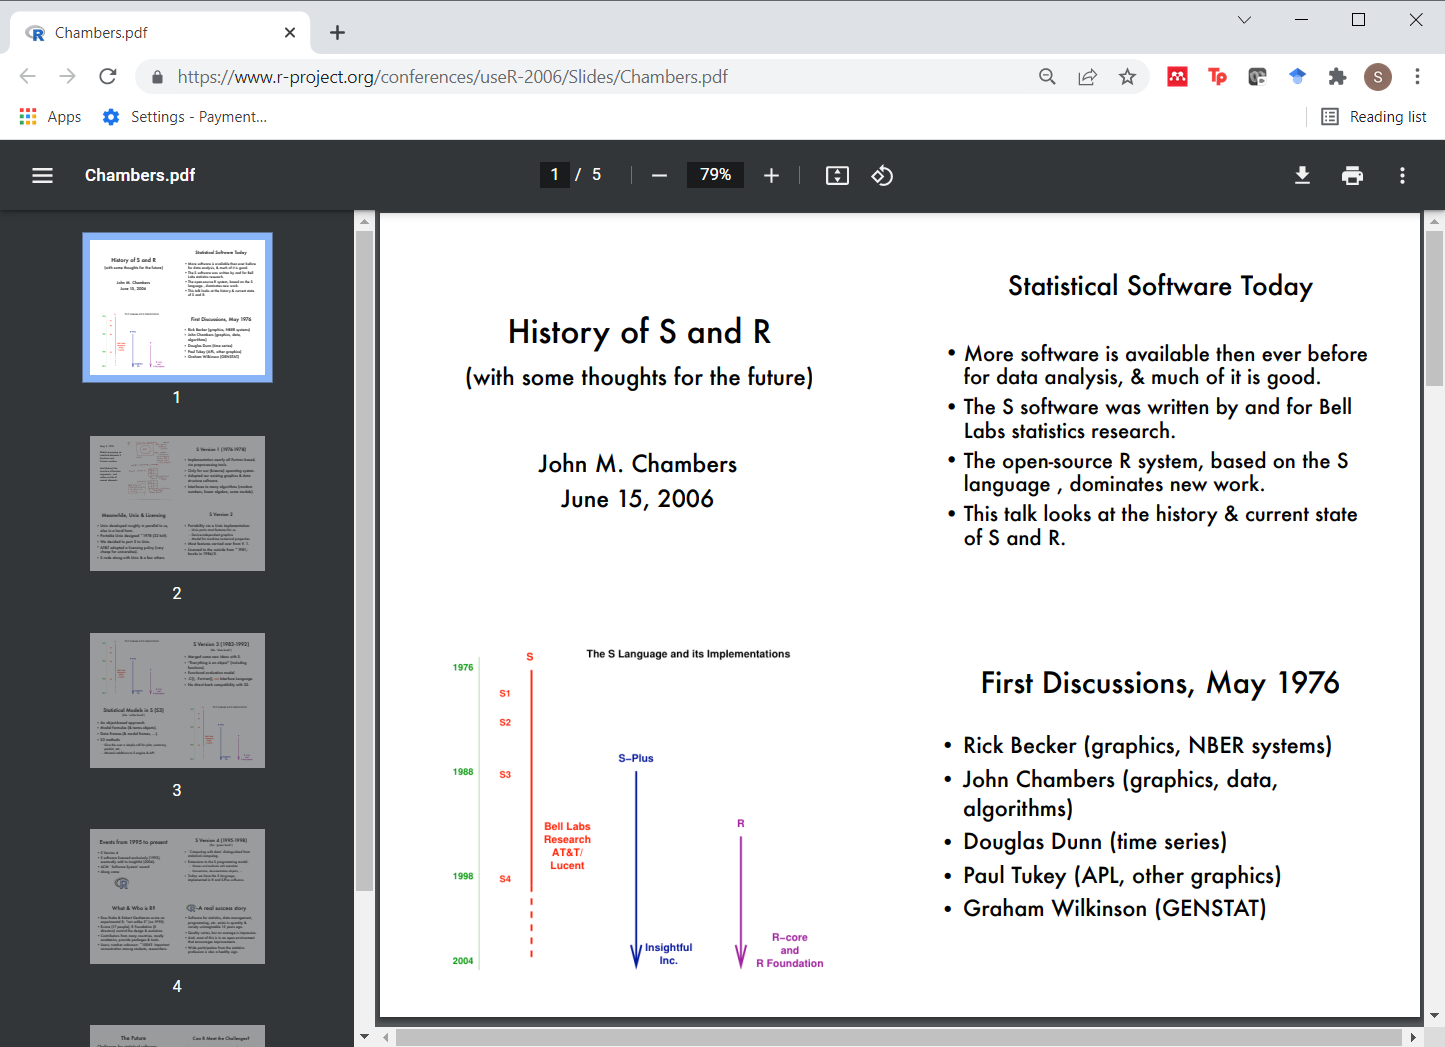
That article has links to the slides (PDF format) of a 2006 talk (again on the history of S) by John Chambers.
If you want to learn more: Hastie 2014
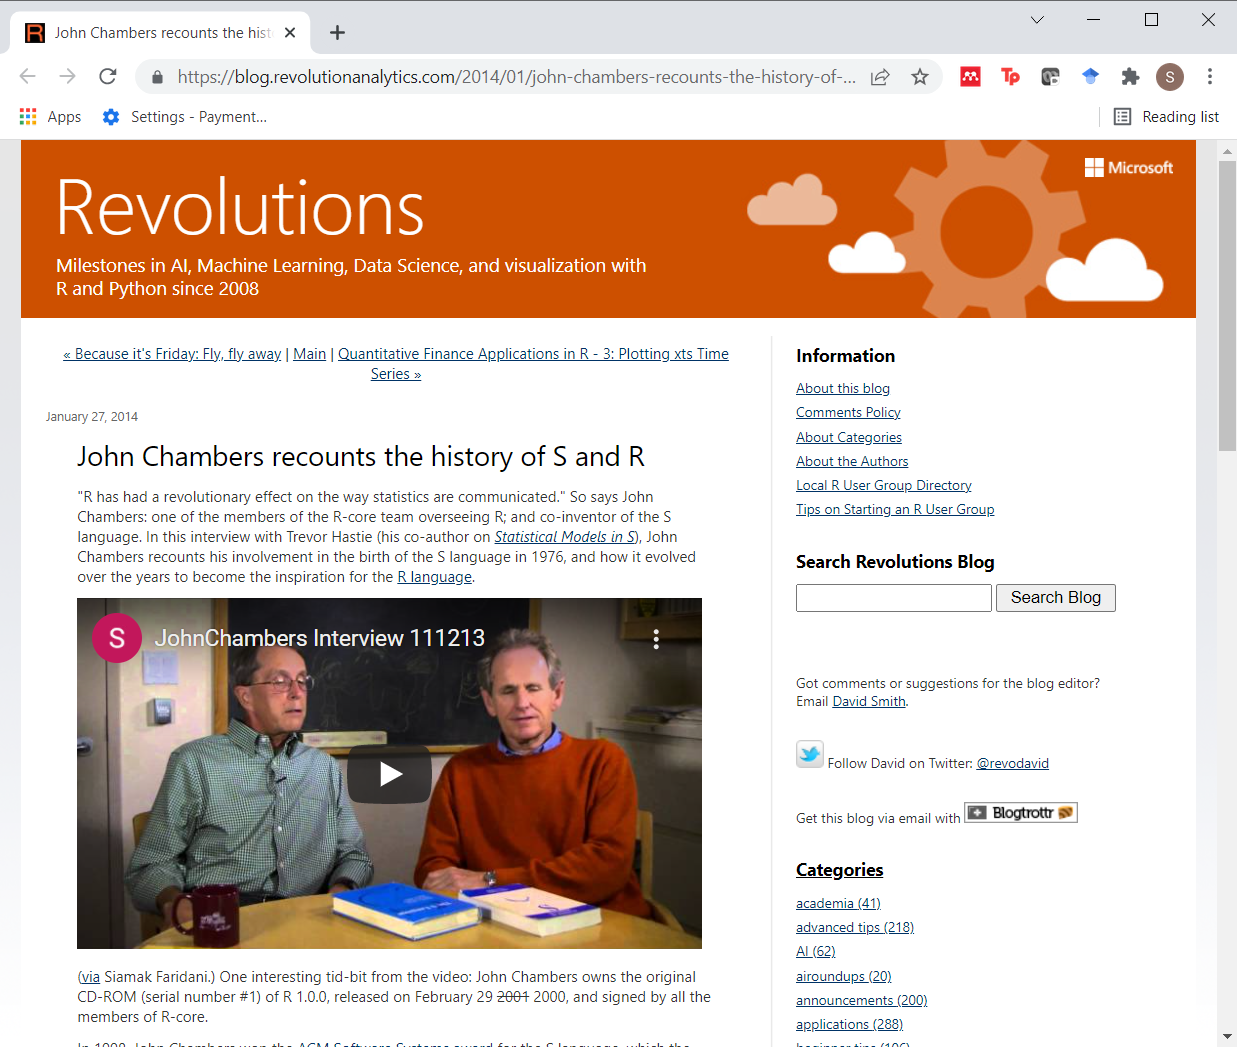
as well as a video interview of John Chambers by Trevor Hastie.
If you want to learn more: Ihaka 1998
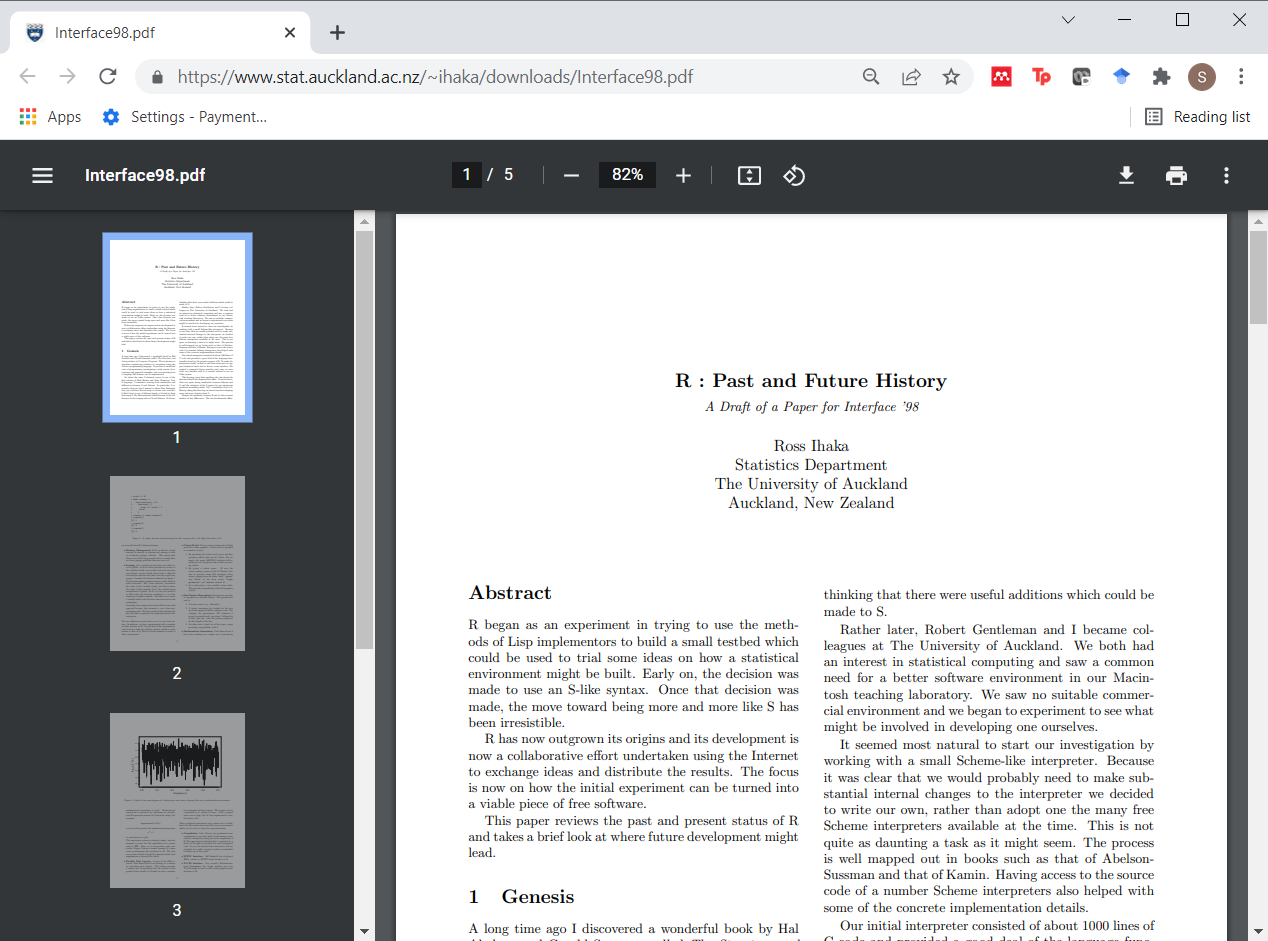
and a 1998 paper (PDF format) by Ross Ihaka on the past (!) and future of R presented at the Interface conference.
If you want to learn more: Becker (no date)
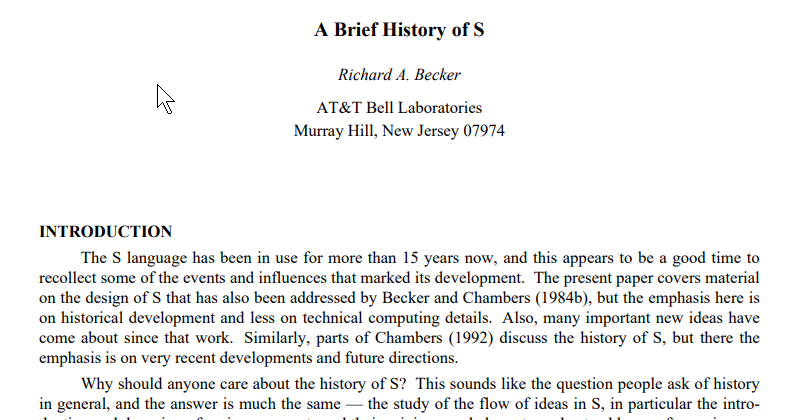
Richard Beckman. A Brief History of S. Available in pdf format
If you want to learn more: Smith 2020
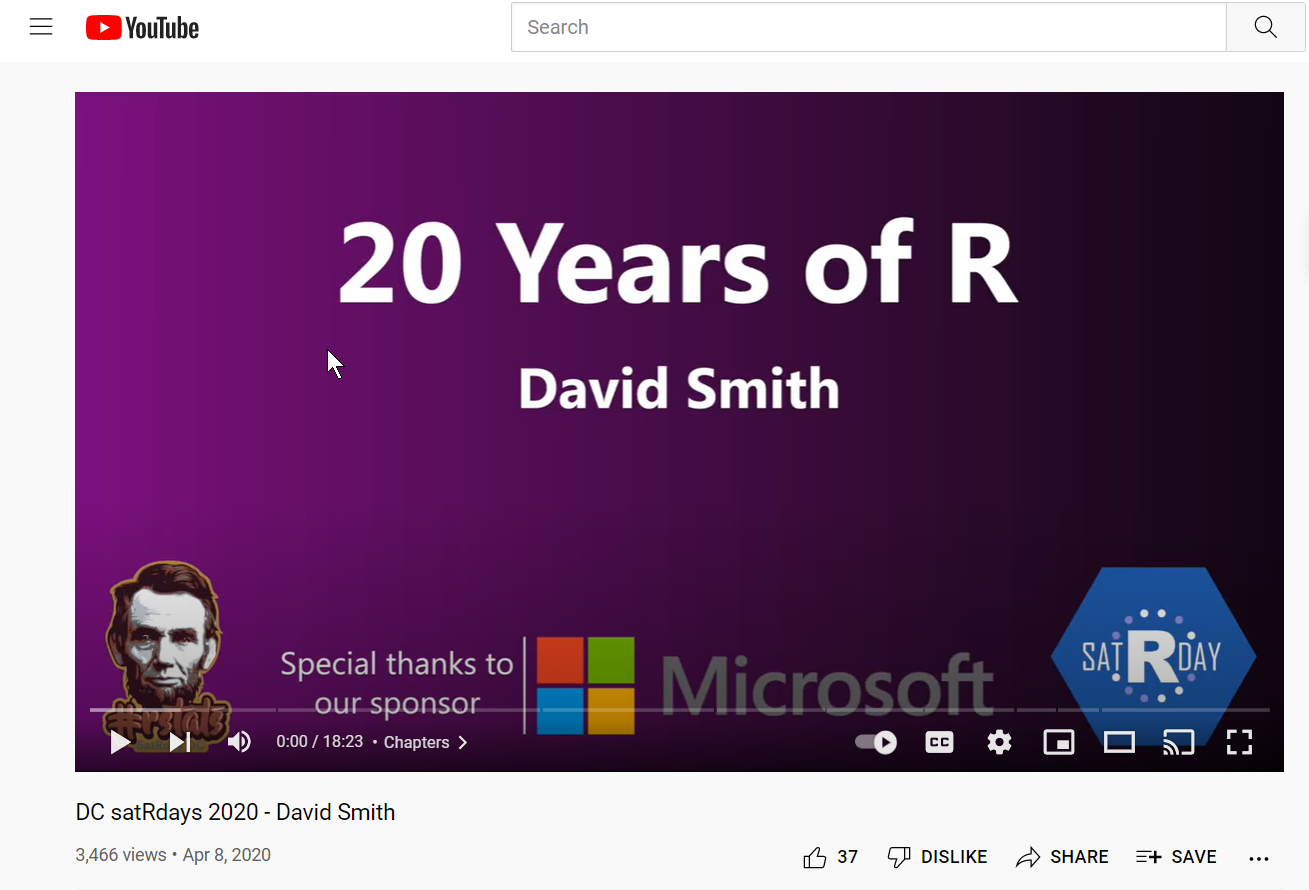
David Smith, 20 years of R, presented at DC satRdays. Available as a YouTube video
You can find an earlier version of this page on my blog.