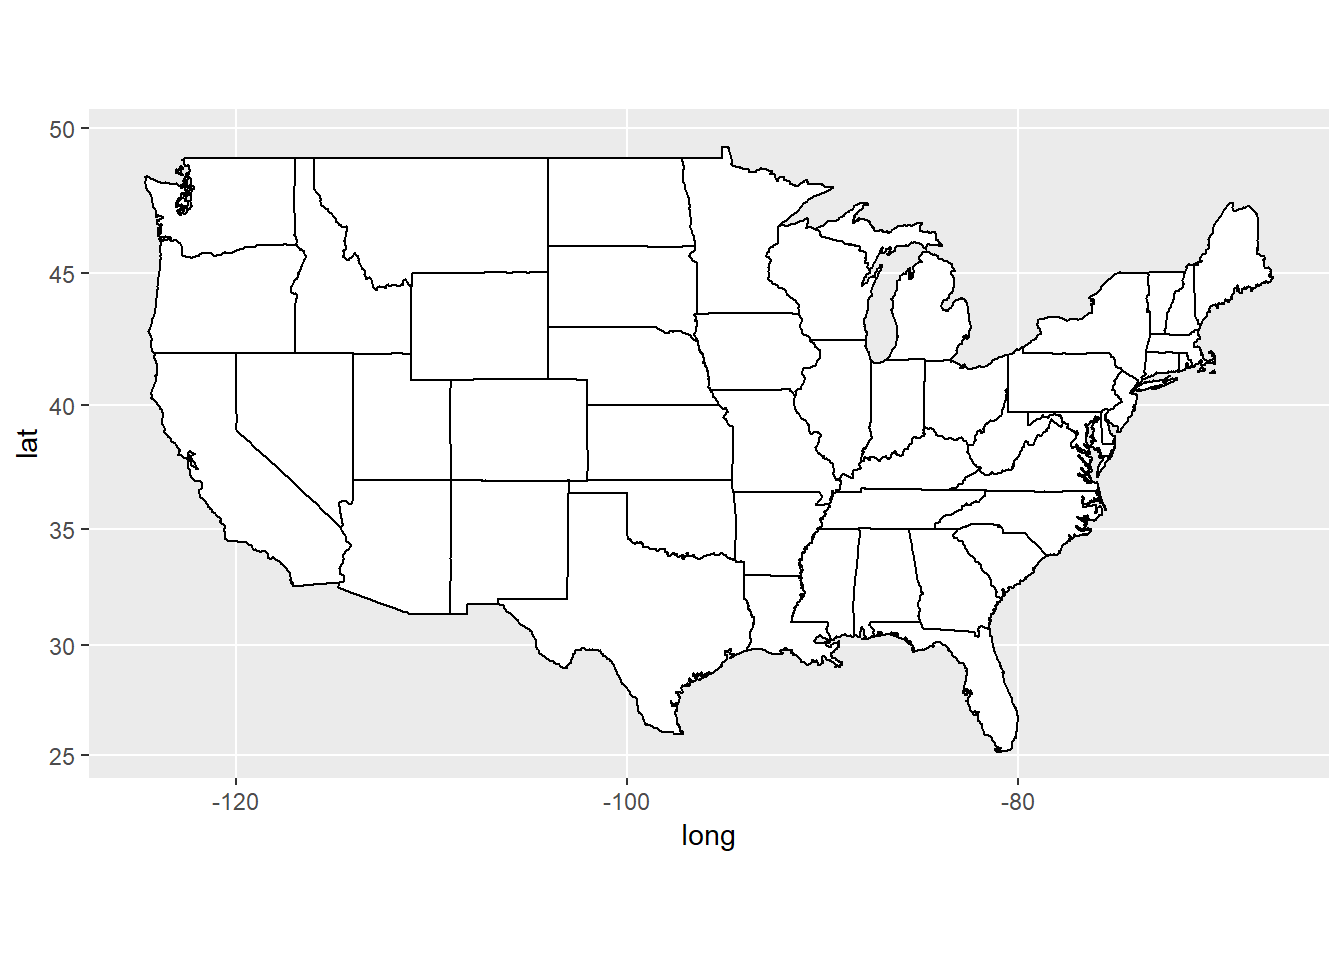
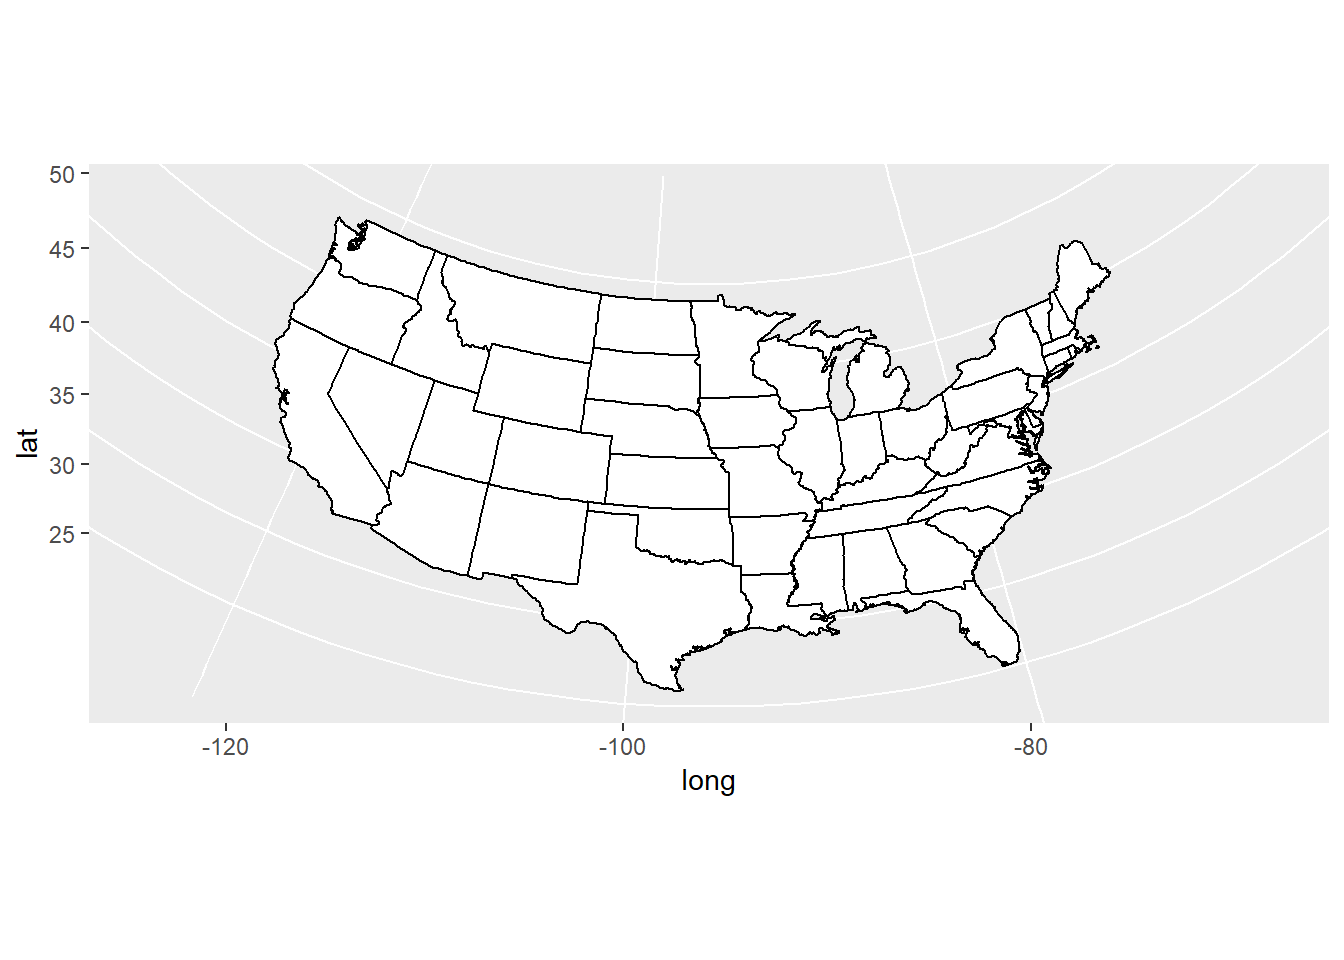
I’m trying to understand some of the basics of mapping and found an interesting example on [this website]
library(maps); library(ggplot2); library(mapproj)
states <- map_data("state")
usamap <- ggplot(states, aes(x=long, y=lat, group=group)) +
  geom_polygon(fill="white", colour="black")
usamap + coord_map("mercator")
usamap + coord_map("azequalarea") 
It helps to peek at the first few rows of data.
head(states)## long lat group order region subregion
## 1 -87.46201 30.38968 1 1 alabama <NA>
## 2 -87.48493 30.37249 1 2 alabama <NA>
## 3 -87.52503 30.37249 1 3 alabama <NA>
## 4 -87.53076 30.33239 1 4 alabama <NA>
## 5 -87.57087 30.32665 1 5 alabama <NA>
## 6 -87.58806 30.32665 1 6 alabama <NA>The plot is based on longitude/latitude pairs. The first thing to realize is that a degree of longitude is smaller than a degree of latitude, except at the equator.
library(dplyr)## Warning: package 'dplyr' was built under R version 4.1.3##
## Attaching package: 'dplyr'## The following objects are masked from 'package:stats':
##
## filter, lag## The following objects are masked from 'package:base':
##
## intersect, setdiff, setequal, unionlibrary(magrittr)## Warning: package 'magrittr' was built under R version 4.1.3library(plot3D)## Warning: package 'plot3D' was built under R version 4.1.2draw_arc <- function(lon=c(0, 360), lat=c(-90, 90), co="black") {
n <- 100
if (length(lon)==1) {lon <- rep(lon, 2)}
if (length(lat)==1) {lat <- rep(lat, 2)}
lon <- seq(lon[1], lon[2], length=n)*pi/180
lat <- seq(lat[1], lat[2], length=n)*pi/180
# formulas from
# https://en.wikipedia.org/wiki/Spherical_coordinate_system
# but swap theta and phi. Also lat=90-phi.
x <- cos(lat)*cos(lon)
y <- cos(lat)*sin(lon)
z <- sin(lat)
segments3D(
x[-n], y[-n], z[-n],
x[-1], y[-1], z[-1],
box=FALSE, add=TRUE, col=co)
}
# Draw some "invisible" points to assure a full view of the arcs.
a <- c(-1, 1)
a_grid <- sapply(mesh(a, a, a), as.vector)
scatter3D(
a_grid[ , 1],
a_grid[ , 2],
a_grid[ , 3],
col="white",
box=FALSE)
for (lat in (-8:8)*10) {draw_arc(lat=lat, co="gray90")}
for (lon in (1:18)*20) {draw_arc(lon=lon, co="gray90")}
draw_arc(lat= 0, co="black")
draw_arc(lat=40, co="red")
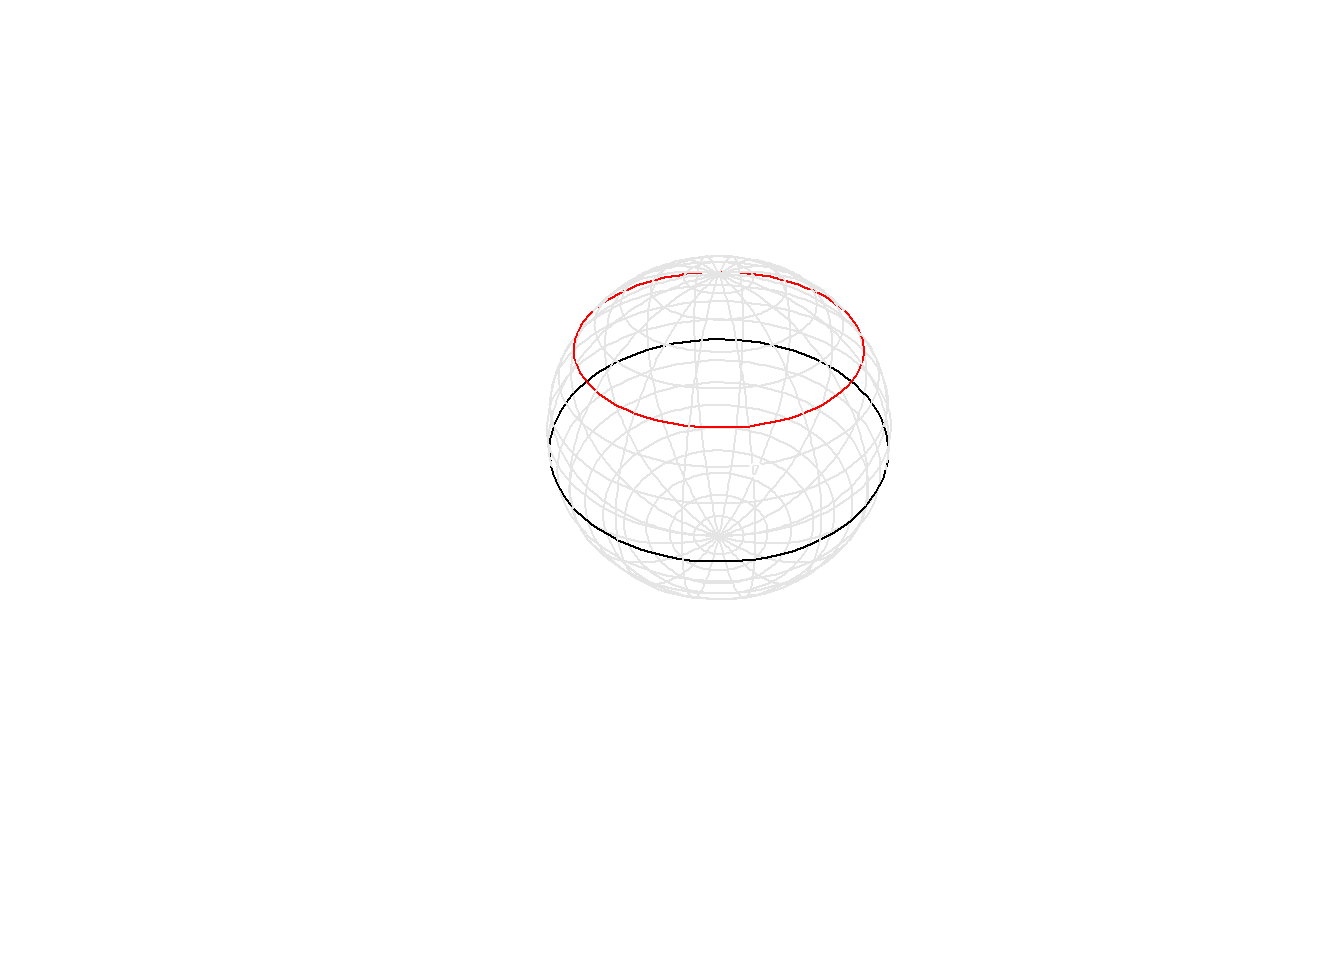
The black circle shows longitude values from -180 to 180 at the equator. The circle at the equator has a perimeter of approximately 40,000 kilometers (25,000 miles). Each degree of longitude at the equator is roughly 111 kilometers.
The red circle, at latitude 40 degrees north (roughly where Columbus Ohio lies) has a smaller perimeter, a bit less than 31,000 kilometers. So near Columbus, Ohio, a degree of longitude is only 85 kilometers.
The further you go north, the smaller the changes. At a latitude of 70 degrees north (roughly the northernmost part of Alaska), each degree of longitude is only 38 kilometers.
scatter3D(
  a_grid[ , 1],
  a_grid[ , 2],
  a_grid[ , 3],
  col="white",
  box=FALSE)
for (lat in (-8:8)*10) {draw_arc(lat=lat, co="gray90")}
for (lon in (1:18)*20) {draw_arc(lon=lon, co="gray90")}
draw_arc(lon=280, lat=c(40, 60), co="darkgreen")
draw_arc(lon=320, lat=c(40, 60), co="darkgreen")
draw_arc(lon=c(280, 320), lat=40, co="darkgreen")
draw_arc(lon=c(280, 320), lat=60, co="darkgreen")
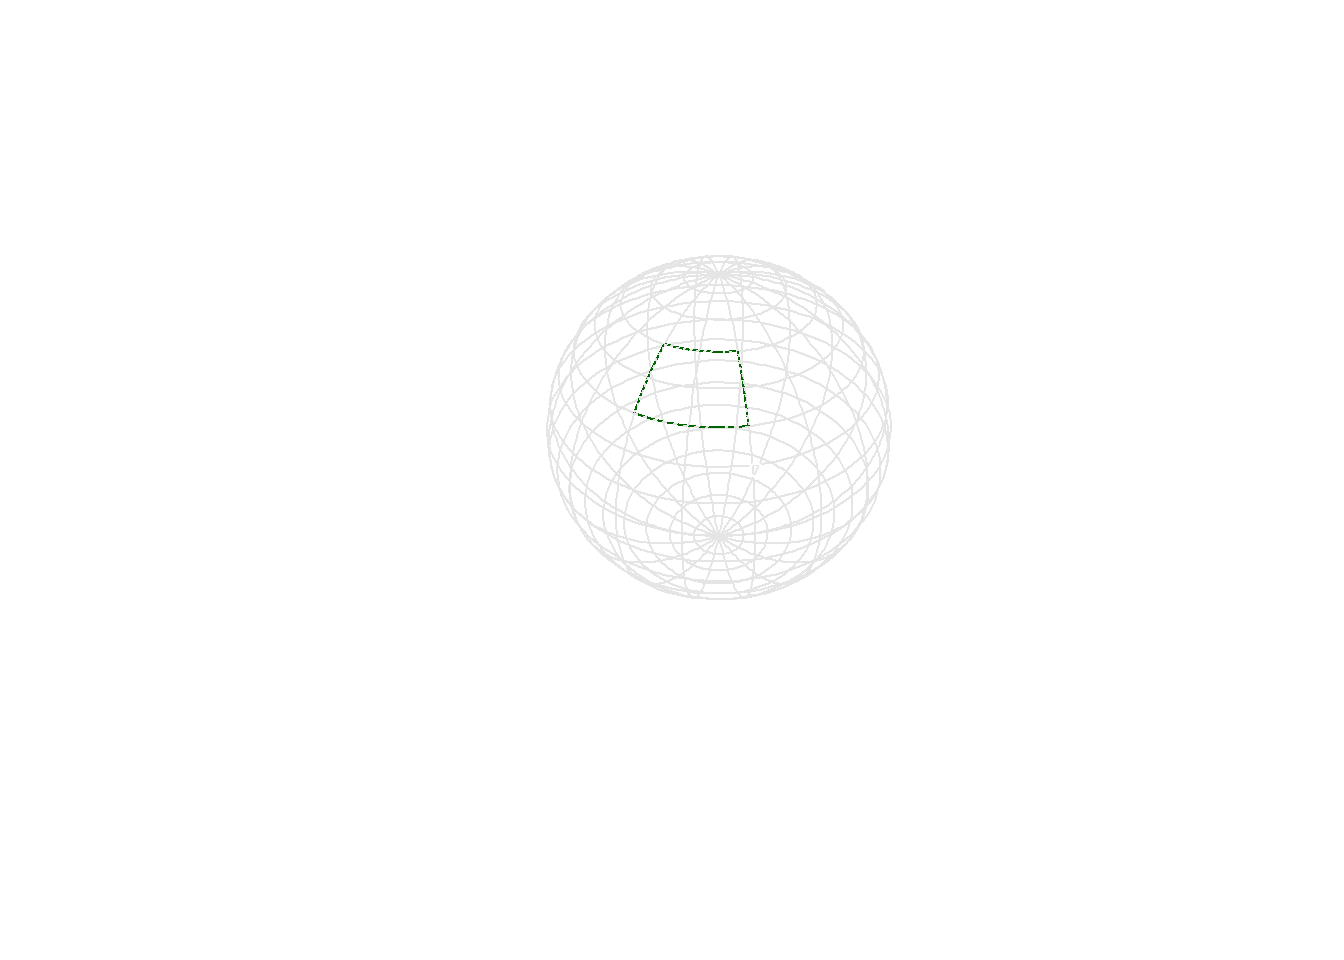
If you pulled out a section of the earth stretching from 100 degrees to 140 degrees longitude (the middle of South Dakota to the western edge of Nevada) and from 40 degrees longitude to about 60 degree longitude (the northern edge of Alberta, Canada), you’d see a shape like the one shown above.
It’s not a rectangle, because the northern edge is quite a bit shorter than the southern edge. But it’s not a trapezoid either, because the boundaries curve in three dimensions. It’s impossible to use any two dimensional shape to represent this curved surface.