I have an R cheat sheet, How Big Is Your Graph, that explains how to measure the size of various features of your graph in R. This blog post illustrates unit conversions. If you want to measure the length of a diagonal line segment in an R graph, you need to calculate the size of the plotting region in pixels, compare that to the range of the plotting region in the x and y directions, and then apply the Pythagorean Theorem.
For many applications, you need to be able to translate user coordinates to pixels or inches. Here’s a simple example.
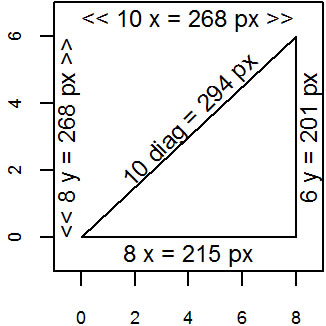
The following code was run inside a program chunk with fig.width=1.7, fig.height=1.7.
par(mar=c(1.9, 1.9, 0.1, 0.1), cex=0.75,
  cex.axis=0.75, xaxs="i", yaxs="i")
plot(c(-1,9), c(-1,7), type="n")
lines(x=c(0,8,8,0), y=c(0,0,6,0)) # triangle
user.range <- par("usr")[c(2,4)] -
  par("usr")[c(1,3)]
region.pct <- par("plt")[c(2,4)] -
  par("plt")[c(1,3)]
region.px <- dev.size(units="px") * region.pct
px.per.usr <- region.px / user.range

a.px <- round(8*px.per.usr[1])
b.px <- round(6*px.per.usr[2])
c.px <- round(sqrt(a.px^2+b.px^2))

text(4, -0.5, paste("8 x =", a.px, "px"))
text(8.5, 3, paste("6 y =", b.px, "px"), srt=90)
text(4, 3.5, paste("10 diag =", c.px, "px"), srt=45)
# Note: srt=45 is just a rough guess

s1 <- paste("<<", round(user.range[1]),
  "x =", round(region.px[1]), "px >>")

s2 <- paste("<<", round(user.range[2]),
  "y =", round(region.px[2]), "px >>")

text(4, 6.5, s1)
text(-0.5, 3, s2, srt=90)
Note: I need to recreate the image
www.pmean.com/0000images/pixel01.jpg
You can find an earlier version of this page on my blog.