A colleague was curious to see the formulas behind the power calculations done by many statistical software programs and online calculators. In particular, she wanted to see the formula used for power of the Chi-squared test of association in a two dimensional contingency table. It gets pretty messy for anything larger than a two by two table, but even a two by two table is a bit tricky. Here ins one mathematical approach that you can choose for a power calculation.
The approach that I most often take with power calculation for a test of association for a two by two table is to treat it as a test of two independent proportions. Here’s an example. You are collecting data on the proportion of women who are still successfully breast feed their newborn child at six months of age. The child is six months old, not the mother. The mothers are randomly assigned to either a treatment group that receives special counseling or a control group. Both groups of mothers are encouraged to breast feed, but the treatment group has a more intensive intervention. The latest statistics seem to indicate that the probability of breast feeding at six months for the typical mother in the United States is around 50%. The number is much lower if you look at exclusive breastfeeding at six months.
The intervention is expensive and would only be worth adopting if the rate of breast feeding increased from 50% to 60%. You want to sample a total of 300 mothers, with twice as many assigned to the treatment group than the control group. Normally this is a bit inefficient, but there are other objectives of the research that require a larger number of women in the treatment group.
Here’s what the two by two table would look like under the ideal setting of no sampling error.
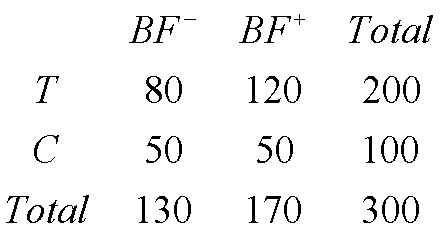
You want to test the hypothesis that the proportion of mothers breast feeding at six months is equal in the treatment and control groups. You plan to test this hypothesis using a two-sided test with an alpha level of 0.05.
Under the null hypothesis, the test statistic,
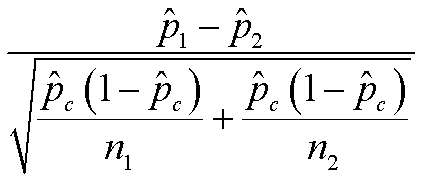
is approximately a normal distribution with mean zero and standard deviation 1 where
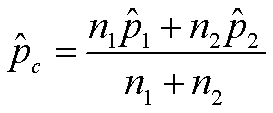
is the estimate of the proportion pooled across both groups. If the alternative hypothesis is true, then test statistic is approximately normal, but the mean is
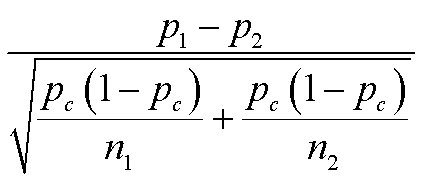
and the standard deviation is
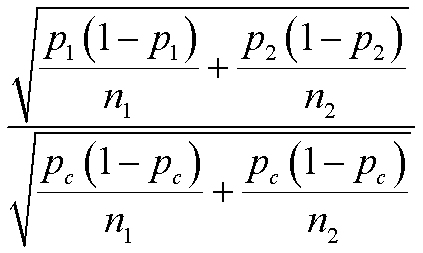
Notice that the hats disappear in these formulas because we are talking about population parameters and not statistics.
For a one sided test, the power would be

where Z* is not a standard normal, but rather the normal distribution described above. To calculate this probability, you need to standardize by subtracting the mean and dividing by the standard deviation.
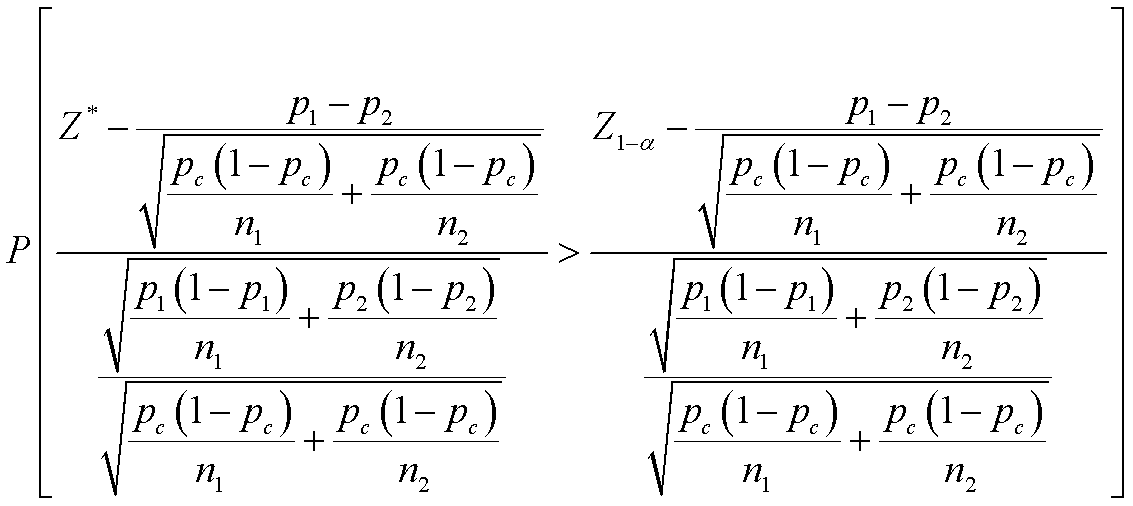
Eeeek! It does simplify a bit. The left hand side is a now a standard normal. And you can cancel a few things on the right hand side.

It’s still a bit messy but manageable. If you wanted to get a sample size that provides you with a specific amount of power, you set that messy thing on the right side of the inequality equal to the 1-beta percentile of a standard normal distribution and solve for the sample size. There are actually two sample sizes here, so you need to assume that the sample sizes of the two groups are equal or perhaps that they vary in a certain ratio (2 to 1 in the example above). I won’t show all the details, but like everything else here, it is more tedious than difficult.
You can find an earlier version of this page on my blog.