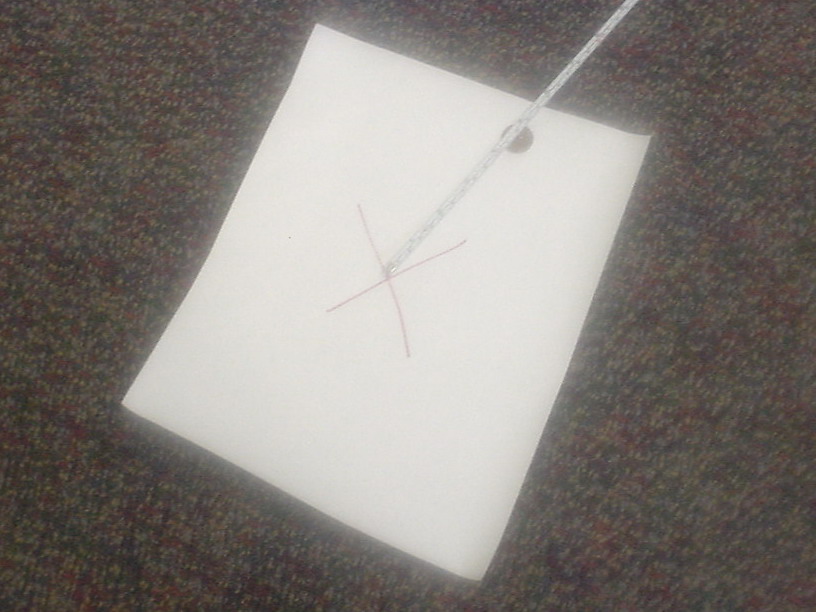
I tried a pilot experiment of a quality control exercise. It seemed to go fairly well. The goal of the exercise was to flip a coin from a table onto a target on the floor below.
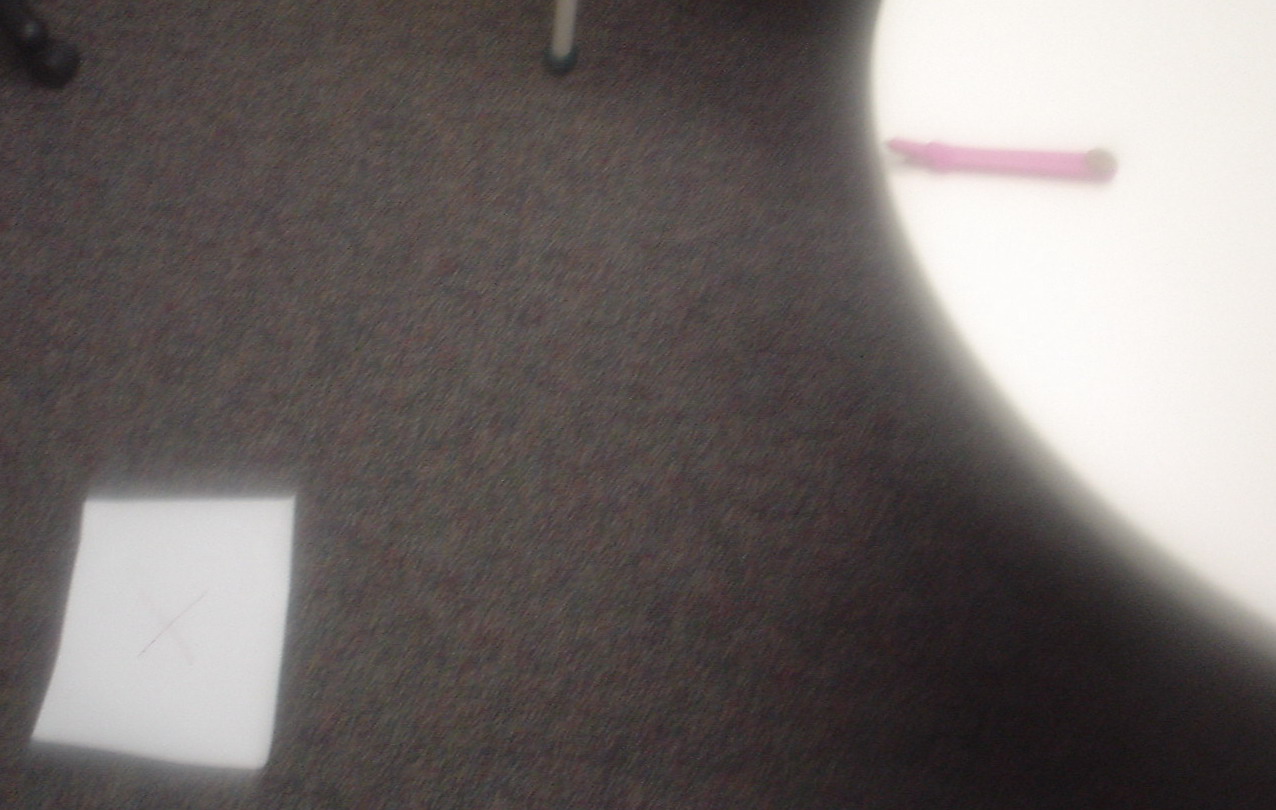
This blurry picture is a recreation of the exercise. A measurer would then note the distance from the penny to the target.
The team had 20 practice flips and then had to write an SOP (standard operating procedure). This was a bit confusing to the team, so I pointed out that they needed to specify the location of the launch point, the location of the target, etc.
After they wrote down an SOP for the coin flip, I asked them to run 20 trials and record the distances from the target. Here is the graph of the results, rather crudely drawn. I drew the graph because there were only two team members in my pilot exercise.
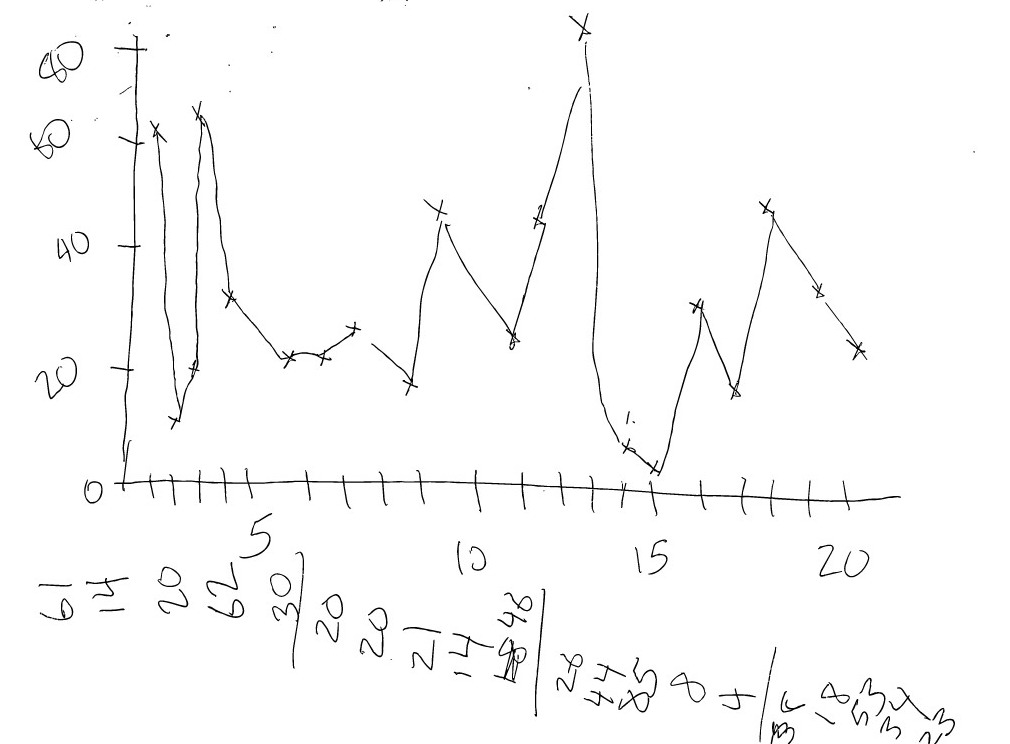
As you can see, the graph doesn’t need to be fancy. After these 20 trials, I asked the team if they could think of a way to improve the process. This was not easy for them to do, but finally they suggested changing the penny to an object that wouldn’t bounce around so much after initial impact. Most of the coin flips landed close enough but then bounced further away. They ended up using a sugar packet. The graph of their next 20 trials appears below.

This entire experiment took about 30 minutes. With a bit more time, I would discuss the computation of a center line and control limits.
Here’s a draft outline of what I am submitting to the organizers of this seminar. Hopefully, it will give you an idea of how I plan to work this example into my training class
Session Content: A hands-on team exercise will encourage you [i.e., the students] to define a simple work process, collect data on that process, try to improve that process, and then measure the success (or lack of success) in your improvement. Then we will cover the three steps needed to establish a quality control program in your laboratory. Finally, you will learn how to calculate limits for a control chart.
Instructional methods: small group exercises and didactic lectures.
Performance objectives: In this class, you will learn how to: identify the three steps needed to implement a quality control program, collect data on a simple work process, graph the trends in that work process to identify trends, and compute control limits to separate common and special cause variation.
You can find an earlier version of this page on my original website.