This page is currently being updated from the earlier version of my website. Sorry that it is not yet fully available.
I am interested in various extensions to the simple Bayesian model for accrual that Byron Gajewski and I derived and published in Statistics in Medicine. An important extension would be a segmented regression model for accrual that would allow for slow accrual at the start of the study, gradually rising to a steady state of accrual. Before I tackle that extension, I want to see how a simpler segmented regression model works in BUGS. I’m borrowing an example from the BUGS manual.
The BUGS example shows two different parameterizations of the segmented linear regression model, and demonstrates that the first parameterization is highly sensitive to initial starting values. I will use the preferred second parameterization. Here it is:
model {
  for (i in 1 : N) {
    Y[i] ~ dnorm(mu[i], tau)
    mu[i] <- alpha + beta[J[i]] * (x[i] - x.change)
    J[i] <- 1 + step(x[i] - x.change)
  }
  tau ~ dgamma(0.001, 0.001)
  alpha ~ dnorm(0.0, 1.0E-6)
  for (j in 1 : 2) {
    beta[j] ~ dnorm(0.0, 1.0E-6)
  }
  sigma <- 1 / sqrt(tau)
  x.change ~ dunif(-1.3,1.1)
}
I want to run this model within R using the rbugs library. Here is the R code to do this.
library("rbugs")

bugs.path <- "c:/Program Files (x86)/OpenBUGS/OpenBUGS321/OpenBUGS.exe"
bugs.wd <- "c:/tmp"

changepoint.dat <- list(Y = c(1.12, 1.12, 0.99, 1.03, 0.92, 0.90, 0.81,
  0.83, 0.65, 0.67, 0.60, 0.59, 0.51, 0.44, 0.43, 0.43, 0.33, 0.30,
  0.25, 0.24, 0.13, -0.01, -0.13, -0.14, -0.30, -0.33, -0.46, -0.43,
  -0.65),
  x = c(-1.39, -1.39, -1.08, -1.08, -0.94, -0.80, -0.63, -0.63, -0.25,
  -0.25, -0.12, -0.12, 0.01, 0.11, 0.11, 0.11, 0.25, 0.25, 0.34, 0.34,
  0.44, 0.59, 0.70, 0.70, 0.85, 0.85, 0.99, 0.99, 1.19),
  N = 29)

changepoint.init1 <- list(alpha = 0.47, beta = c(-0.45, -1.0),
  tau = 5, x.change = 0.5)
changepoint.init2 <- list(alpha = 0.47, beta = c(-0.45, -1.0),
  tau = 5, x.change = -0.5)
changepoint.inits <- list(changepoint.init1, changepoint.init2)

changepoint.model <- "ChangepointModel.txt"

changepoint.pars <- c("alpha", "beta", "sigma", "x.change")

changepoint.sim <- rbugs(data = changepoint.dat,
  inits = changepoint.inits, paramSet = changepoint.pars,
  model = changepoint.model, n.chains = 2, n.iter = 10000,
  n.burnin = 1000, n.thin = 1, bugs=bugs.path,
  workingDir = bugs.wd, bugsWorkingDir = bugs.wd)

changepoint.comb <- rbind(changepoint.sim$chain1, changepoint.sim$chain2)

changepoint.quant <- apply(changepoint.comb, 2, quantile,
  probs=c(0.025, 0.5, 0.975))
You can get a nice table of the estimated values and 95% credible intervals with
round(changepoint.quant,3)
which produces
      alpha beta[1] beta[2] deviance sigma x.change
2.5%  0.484  -0.450  -1.049   -149.4 0.017   -0.289
50%   0.535  -0.418  -1.014   -144.7 0.022    0.029
97.5% 0.759  -0.314  -0.919   -100.9 0.041    0.091
The estimated values and 95% credible intervals match up fairly closely with the example in BUGS

but not perfectly. A perfect match is not expected, of course, because this is a simulation. There are actually some important differences between the two outputs that I did not notice immediately. Can you spot them?
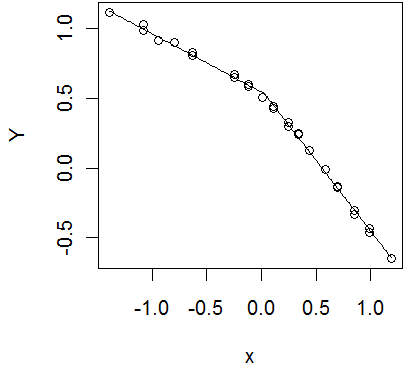
Here’s a graph of the data and the estimated regression equation.

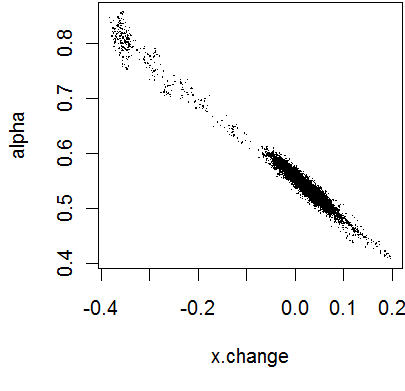
The parameter alpha represents the estimated mean at the changepoint, so you would expect a fair degree of correlation between the two quantities. An earlier changepoint means a higher alpha and a later changepoint means a smaller alpha. I was curious about how strong this correlation was, so I created a scatterplot.

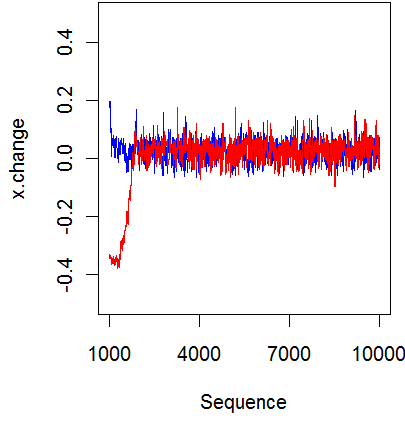
Uh oh! This looks like a bimodal distribution, which could be real, but could also be an indication of the failure of convergence for the Markov Chain Monte Carlo. Here’s a plot of the two chains.

The second chain, in red, has not converged yet, even though I discarded the first thousand observations. If you discard an additional thousand observations, then the scatterplot
~Figure 5. Revised scatterplot of x.change and alpha
no longer has the bimodal pattern. The table of estimates and credible intervals
      alpha beta[1] beta[2] deviance sigma x.change
2.5%  0.487  -0.449  -1.048   -149.5 0.017   -0.036
50%   0.534  -0.419  -1.014   -144.9 0.022    0.031
97.5% 0.585  -0.391  -0.981   -134.1 0.030    0.087
is slightly different and much closer to the results reported in BUGS.
You can find an earlier version of this page on my original website.