A group of residents wanted me to look at an article because they were confused about the calculation of the likelihood ratio. The numbers that they got were quite different from those in the publication. It turns out that they were calculating things correctly, and did not realize that the paper had several serious errors in some of the more fundamental calculations of sensitivity and specificity.
Here is the paper they showed me
A clinical score to reduce unnecessary antibiotic use in patients with sore throat. McIsaac WJ, White D, Tannenbaum D, Low DE. Cmaj 1998: 158(1); 75-83. Abstract PDF
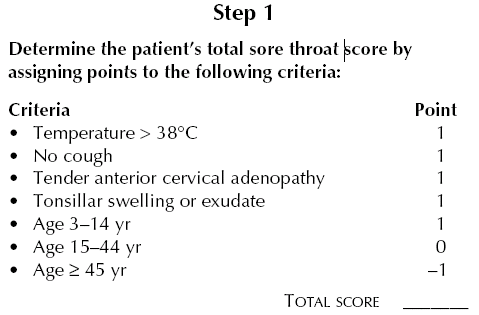
This paper developed a score to assign to patients who came in complaining of a sore throat to see if they needed to be prescribed antibiotics. The scale was computed using the following formula:

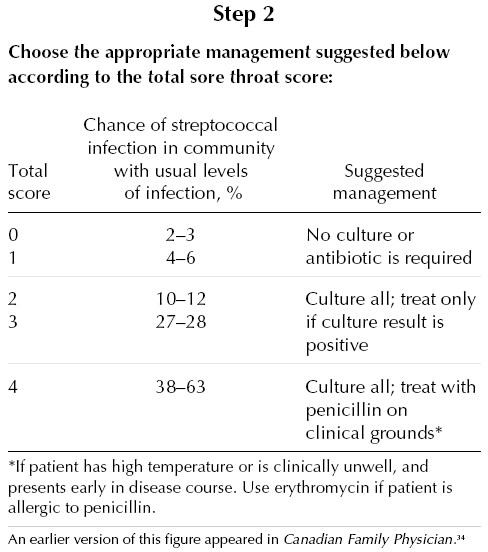
Although scores of -1 and 5 and theoretically possible, no one scored below zero or above 4. The paper suggests the following management strategy:

The results of this score were compared to the physicians subjective evaluation and to a throat swab culture (the gold standard). There are several errors in the calculations of sensitivity and specificity in this paper, but the most obvious one is the claim that:
Among children aged 3 to 14 years, there was no difference between the 2 approaches in the proportion receiving antibiotics or from whom throat swabs were obtained, but significantly more cases of GAS infection would have been identified with the score approach (96.9%) than with usual physician care (70.6%) (p < 0.05). Physician specificity was higher, however (91.7% v. 67.2%) (p < 0.05). Among adults the sensitivity of physician judgement and of the score approach were similar, but both throat swab use (37.3% v. 26.4%) and antibiotic prescription (16.5% v. 3.4%) would have been reduced with the score approach (p < 0.001).
This data is corroborated in Table 3, where the sensitivity for patients aged 3-14 years is reported as 96.9% (31/32) and specificity as 94.3% (413/438). An excerpt from the table is reproduced below.


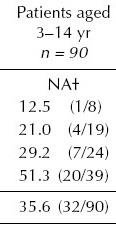
The residents could not reproduce these numbers because they were looking instead at Table 4, a portion of which is reproduced below.


Can you spot the error in the sensitivity and specificity calculations?
You can find an earlier version of this page on my original website.