A doctor brought me some data from a crossover design and asked me to help analyze it. The analysis was a bit trickier than I had expected, so I reviewed some of the material in Stephen Senn’s book.
The hallmark of a crossover trial is that it is a study where both the standard treatment and the experimental treatment are both given to the same patient. In a parallel group trial, you flip a coin to decide which treatment a patient gets. In a crossover trial, you flip a coin to decide the order of the treatments, either the standard treatment followed by the experimental treatment or the experimental treatment followed by the standard treatment.
Part of the confusion I had with the crossover design was my failure to recognize that there are two different ways to present the data. In both formats, you need to specify the order that was randomly assigned to the patient. I am using an example data set from the OzDASL website. It represents a crossover trial where patients received both Vitamin C and a placebo. Patients who were randomly assigned to receive Vitamin C followed by placebo are noted by the code VP and patients who were randomly assigned to receive placebo followed by Vitamin C are noted by the code PV. The outcome variable is a measure of endurance.
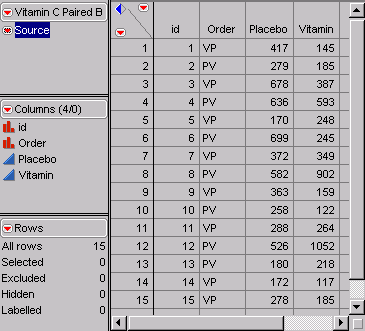
In the format shown above, the endurance measure when the placebo is given appears in the column labeled “Placebo” and the endurance measure when Vitamin C is given appears in the column labeled “Vitamin.”
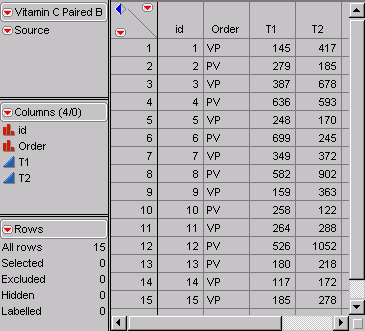
In the format shown here, the endurance measured the first time appears in the column labeled “T1” and the endurance measured the second time appears in the column labeled “T2.” The two formats look similar, but when the order is VP (patients 1, 3, 5, 7, 9, 11, 14, and 15) the values for T1 and T2 are reversed from the values for Placebo and Vitamin.
You can compute a paired t-test with the data in either format. When you compute a paired t-test in the first format, it is testing whether there is a difference between the placebo treatment and the Vitamin C treatment, assuming that there is no period effect. When you compute a paired t-test in the second format, it is testing whether there is a difference between the first period and the second period, assuming there is no treatment effect. What I really needed was a test that allowed for looking at both treatment effects and period effects simultaneously. To do this effectively, it helps to produce a third format for the data.
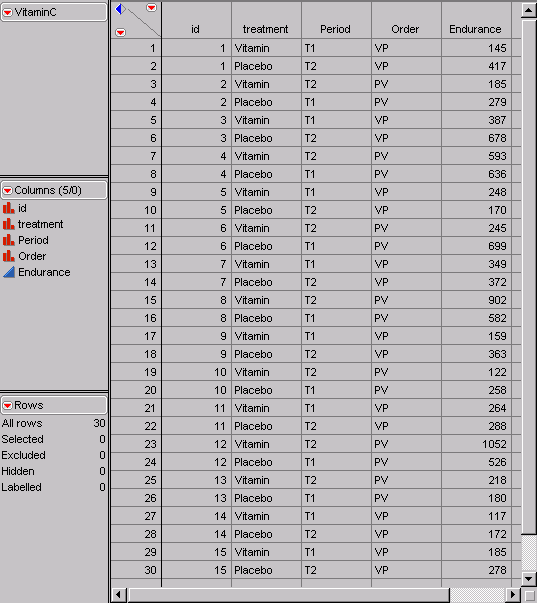
In the format shown above, the endurance values appear in a single column. Since endurance is measured twice on each of 15 patients, this requires a total of 30 rows. For each of the individual endurance values, you have to note which patient it is (the column labeled id), whether the endurance was measured after treatment with Vitamin C or placebo (the column labeled treatment), whether the endurance was measured during the first period or during the second period, whether the patients was randomly assigned to the PV order or the VP order (the column labeled Order) and finally what the actual endurance value was (the column labeled Endurance).
The second point of confusion that I had was my failure to recognize a redundancy among the treatment, Period, and Order variables. If you specify any two of these three variables, then the third one is determined automatically. For example, if you knew that the treatment Vitamin was during period T1 and that the treatment Placebo was during period T2, then you would know without fail that the Order would have to be VP.
This redundancy produces two major insights. First, you can’t test for treatment, period, and order effects simultaneously. Second, you can’t test for a treatment by period interaction. If you code the treatment and Period columns using -1 and +1, then the product of these two columns would be identical to a -1 and +1 coding for Order.
Id Tr Pe Or T*P
 1  1 -1 -1 -1
 1 -1  1 -1 -1
 2  1  1  1  1
 2 -1 -1  1  1
 3  1 -1 -1 -1
 3 -1  1 -1 -1
 4  1  1  1  1
 4 -1 -1  1  1
 5  1 -1 -1 -1
 5 -1  1 -1 -1
 6  1  1  1  1
 6 -1 -1  1  1
 7  1 -1 -1 -1
 7 -1  1 -1 -1
 8  1  1  1  1
 8 -1 -1  1  1
 9  1 -1 -1 -1
 9 -1  1 -1 -1
10  1  1  1  1
10 -1 -1  1  1
11  1 -1 -1 -1
11 -1  1 -1 -1
12  1  1  1  1
12 -1 -1  1  1
13  1  1  1  1
13 -1 -1  1  1
14  1 -1 -1 -1
14 -1  1 -1 -1
15  1 -1 -1 -1
15 -1  1 -1 -1
This failure to recognize the redundancy meant that I failed to understand that in a two period crossover design, you cannot test for a treatment by period interaction. Only a more complex crossover design, such as a design with four periods and two crossovers, will allow you to test for such an interaction.
In a future weblog entry, I will show a formal analysis of the crossover data.
You can find an earlier version of this page on my old website.