The statistical design and analysis issues for research involving children are not really that much different than for adults, but there are three areas that you need to pay special attention to: sample size issue, subgroup analysis, and validity/reliability of measurements. I want to summarize some of these issues and offer some concrete examples. The two statistical issues boil down to validity and sample size.
Establishing validity in a study involving children
Every discipline has its own definition of validity, but in general it can be thought of as truth-in-packaging. A measurement is valid if it actually measures what it is claiming to measure. If it is measuring something else, it is not a valid measurement.
For example, there are a lot of studies looking at stress and its relationship to health. So how do you measure stress?
-
You can look at physiologic signs.
 academic.cuesta.edu/wholehealth/Level2/Lecpages/str07.htm
 -
You can hook someone up to a meter that measures stress.
 height=“336”}
www.cliving.org/stresstools.htm
height=“336”}
www.cliving.org/stresstools.htm -
You can ask people to fill out a survey.
 www.agnet.org/library/image/pt2003033t1.html
Just because you attach the label “stress” to a questionnaire or an electronic device does not mean that the label is accurate. How do you know, for example, that you are not measuring anxiety instead of stress?
How do you establish validity? It’s too much for me to talk about today. There’s an excellent book,
- Health Measurement Scales A Practical Guide to Their Development and Use. David L. Streiner, Geoffrey R. Norman (1989) New York: Oxford University Press, Inc.
which offers a lot of practical advice.
One point I want to emphasize is that establishing validity is not a one shot deal. You don’t run a single statistical test and conclude valid/invalid on that basis. Validity is the slow and careful accumulation of information across multiple studies. Think of validity as a journey and not a destination.
The other point that I need to make is that a measurement that is valid in one population is not necessarily valid in another population. There are physiologic, cultural, and language differences between various ethnic and racial groups for example, and these differences could ruin a measurement that is nicely validated on one population.
Children represent a special group, and measurements validated on adults should not be considered as being automatically valid in children. There are certain things we take for granted in adults that are not true for children or which are only true for children above a certain age threshold.
- The ability to speak.
- The ability to read.
- The ability to write.
- The ability to understand abstract concepts.
By “abstract concepts” I don’t mean “beauty” or “truth”. Much simpler tasks, like marking a line on a visual analog scale to represent the degree of pain intensity or selecting a value from one to ten, require an understanding of numbers, order, and distance. A child that is not capable of counting from one to ten would not be able to perform a task like this. The situation is hopeless, though. For a child that has only limited verbal skills, the following graphic can be used to measure pain.
 (Source:
painsourcebook.ca/pdfs/pps92.pdf)
(Source:
painsourcebook.ca/pdfs/pps92.pdf)
What about infants, who can’t even understand an instruction about which face to point to? The issues are complex,
- Reflections on measuring pain in infants: dissociation in responsive systems and “honest signalling”. Barr RG. Arch Dis Child Fetal Neonatal Ed 1998;79:F152-F156 (September). [Full text]](http://fn.bmjjournals.com/cgi/content/full/79/2/F152) [PDF]](http://fn.bmjjournals.com/cgi/reprint/79/2/F152.pdf)
but pain measurements are indeed possible, even in premature infants.
Another dimension to validity is the concept of a normal range. What is considered normal (and therefore safe) in adults is quite different from what is normal and safe in children. Heart rates, lung function, and blood pressure vary by age and by gender in children.
Assessing an appropriate BMI is a good example of the problems you face. In adults, there are well accepted standards: above 25 and you are overweight, 30 and higer and you are obese. In children, the values vary markedly by age and gender. Here’s a chart of the percentiles of BMI for girls ages 2 to 20 (reduced in size to make it fit better here).
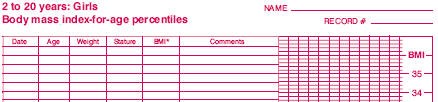

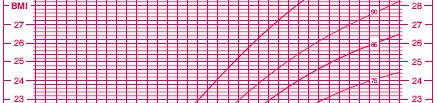
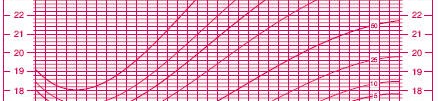
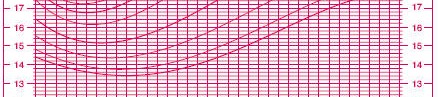
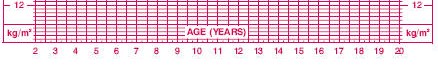

(Source: www.cdc.gov/nchs/data/nhanes/growthcharts/set1clinical/cj41c024.pdf)
So a BMI of 20, for example, is troublesome in a 4 year old girl, but not in a 16 year old girl.
A third problem is the reliance on proxy reports. Younger children do not have sufficient language skills to be able to describe quality of life issues, so we rely on reports from parents and teachers. Are these people in a position to provide an informed opinion about the child?
Sample size concerns in a study involving children
For many diseases, the number of affected children is a small fraction of the number of adults who are affected. There are at least two reasons for this.
First, children represent a small fraction of the entire demographic population, with the possible exception of developing countries that still have very high birthrates. Here’s the age distribution in England and Wales. The median age in England and Wales is 37 years, and less than 25% of the population is under the age of 20.
Source:
www.statistics.gov.uk/census2001/pyramids/pages/727.asp
Second, some diseases are the result of decades of abuse that we heap upon ourselves through sedentary lifestyles, overeating, smoking, abuse of alcohol and other drugs. Children don’t have easy access to tobacco and alcohol. Lack of exercise and too much television are indeed a problem for children, but they will not reap many of the consequences of this behavior until they become adults. Some medical conditions are consequences of the aging process and appear outside of adults only in rare cases.
There are some diseases and conditions, of course, which are unique to children, and others that occur. But as a general rule, children represent a small subgroup.
There are two statistical issues here associated with the adjective “small” and the noun “subgroup.”
Small sample size problems represent the biggest crisis in medical research today. But with pharmacovigilance, it is that much worse, because you are quite often for a “needle in a haystack.” Also remember that you are looking for something that went undetected with the typical sample size in a Phase III study.
So what sort of sample size do you need in a pharmacovigilance study? There are plenty of formulas, but one rule that I have found useful is the “rule of 50”. It was originally developed by Gerald Van Belle. It appeared in the first draft of his excellent book, Statistical Rules of Thumb (ISBN: 0471402273), which was available on the web. Somehow, the “rule of 50” did not make it into the final draft of the book.
The rule of fifty applies when you are comparing two binomial proportions. A reasonable goal for your sample size is to have adequate power to detect a doubling or halving of the proportion. The sample size has to be large enough so that you observe 50 events in one group and 25 events in the other group.
The derivation of the rule of 50 is quite simple. The classic formula for sample size is
The notation here is fairly standard


Assume that the probability of success is small in both groups, so that the probability of failure is close to 1. Also assume that we are trying to detecting a 50% decline in the probability of success from group 1 to group 2. Assume that the ratio of the two sample sizes is 1. Finally, assume that we want an alpha level of 0.05 for a two sided test and a beta level of 0.20. With these assumptions, we get the following relationships.

Substitute these values into the formula for sample size to get
which simplifies to
We round this up to 50.
What does this mean in a practical sense? The quantity n~1~p~1~ represents the expected number of events in group 1, and you want to select n~1~ sufficiently large so that n~1~p~1~ is at least 50. Alternately, select n~2~ sufficiently large so that n~2~p~2~ is at least 25 So if you are studying a side effect that occurs in about 1% of the untreated patients, and you want to be able to detect a doubling of this rate to 2% in the treated group, then select the number of treated patients, n, so that 0.02n=50 (or equivalently 0.01n=25). This tells you that your sample size should be approximately 2,500.
A real world application of the rule of 50. An article by Schwartz et al proposes an interesting scenario for a research study (N Engl J Med. 1998;338:1709-1714). These authors noticed an association between prolonged QT interval and Sudden Infant Death Syndrome. In the discussion of these findings, the authors raise the possibility of screening all newborn infants using electrocardiography and the placing those infants with prolonged QT intervals on a beta blocker. The authors discuss the complexity of the cost benefit issues, which is beyond the scope of this web page. It is interesting, however, to speculate on how to test whether beta blockers would be effective as a therapy to prevent SIDS in those infants with long QT intervals.
The paper provides much interesting data to help you calculate an appropriate sample size for this study. The risk of SIDS in infants with prolonged QT intervals is 1.5%. Suppose that a beta blocker could cut this risk in half (to 0.75%). What sample size would you have to collect in order to have adequate power?
The rule of 50 tells us that we would need 50 SIDS events in the placebo arm of the trial. At a rate of 1.5% that translates into recruiting 50 / 0.015 = 3,333 infants with prolonged QT interval for the placebo arm. You would recruit a similar number of infants for the beta-blocker arm of the study.
Not every infant, however, will have a prolonged QT interval. The cutoff used in this paper for a prolonged interval represented the 97.5 percentile. So only 2.5% of the infants screened could qualify to be in the study. In order to recruit 6,666 infants who qualify for the study, you would have to screen 6,666 / 0.025 = 266,640 normal infants.
Subgroup analyses. Subgroup analyses raise troubling issues. The number of possible subgroups that could be analyzed is large. But if you adjust for multiple comparisons, you lose a lot of power. And this loss of power is exacerbated by the sample size of the subgroups which is always less (sometimes much less) than the total sample size.
Another big problem is that many researchers apply the wrong statistical test to the subgroup by testing each subgroup independently from the overall results. So if you have an overall p-value of 0.06, but you compute a slightly smaller p-value, 0.04, in children, there are some who would say that the side effect is not present in adults, but is present in children. The only appropriate test for subgroups is a formal test of interaction.
So what should you do? There is a nice overview on subgroup analysis in clinical trials,
- Subgroup analysis in clinical trials. Cook DI, Gebeski VJ, Keech AC, MJA 2004; 180 (6): 289-291. [Full text]](http://www.mja.com.au/public/issues/180_06_150304/coo10086_fm.html) [PDF]](http://www.mja.com.au/public/issues/180_06_150304/coo10086_fm.pdf)
and the discussion can be easily applied to pharmacovigilance trials. This paper offers the following checklist:
Box 2. Checklist for subgroup analyses.
Design
- Are the subgroups based on pre-randomisation characteristics?
- What is the impact of patient misallocation on the subgroup analysis?
- Is the intention-to-treat population being used in the subgroup analysis?
- Were the subgroups planned a priori?
- Were they planned in response to existing trial or biological data?
- Was the expected direction of the subgroup effect stated a priori?
- Was the trial designed to have adequate power for the proposed subgroup analysis?
Reporting
- Is the total number of subgroup analyses undertaken declared?
- Are relevant summary data, including event numbers and denominators, tabulated?
- Are analyses decided on a priori clearly distinguished from those decided on a posteriori?
Statistical analysis
- Are the statistical tests appropriate for the underlying hypotheses?
- Are tests for heterogeneity (ie, interaction) statistically significant?
- Are there appropriate adjustments for multiple testing?
Interpretation
- Is appropriate emphasis being placed on the primary outcome of the study?
- Is the validity of the findings of the subgroup analysis discussed in the light of current biological knowledge and the findings from similar trials?
Many pharmacovigilance studies are not randomized, and many of the findings in these studies are post hoc. This makes subgroup analysis even more troubling, but you don’t really have a choice. I have found the criteria for causation developed in a 1965 article by Sir Austin Bradford Hill “The Environment and Disease: Association or Causation” to be very helpful. He mentions nine factors:
- Strength (is the risk of a side effect so large that we can easily rule out other factors)
- Consistency (have the results have been replicated by different researchers and under different conditions)
- Specificity (is the exposure associated with a very specific side effect as opposed to a wide range of side effects)
- Temporality (did the drug treatment precede the side effect)
- Biological gradient (are increasing drug dosages associated with increasing risks of the side effect)
- Plausibility (is there a credible scientific mechanism that can explain the association)
- Coherence (is the association consistent with the natural history of the side effect)
- Experimental evidence (does a physical intervention show results consistent with the association)
- Analogy (is there a similar result that we can draw a relationship to)
There is no magic rule, such as 7 out of 9 will guarantee causation. Instead, presence of any of the nine factors will strengthen the quality of the evidence and absence of any factor will dilute the quality of the evidence.
Data entry issues in a study involving children.
There are some important data elements in a pediatric research study that are not normally included in an adult research study. Not all of these elements should be collected in every research study, of course. The context of the problem you are working on is critical.
More detailed information about age:
Most studies report age truncated to the lower integer. So an age of 51 means that the patient has experienced his/her 51st birthday, but not the 52nd birthday. In children, you may need a greater level of detail. If you wish to use a growth chart, you need to know age in months. For infants, age in days may be necessary. If you are studying pre-term births, you should also specify the post-conceptual age. In some studies where the onset of puberty is critical, you might need to include a Tanner stage.
Characteristics of the delivery and pre-natal exposures:
Although the effects in older children is less apparent, for younger children, and especially infants, you might need to collect information about the birth process, such as birthweight, length of stay in the birth hospital, and apgar scores. The type of delivery (vaginal or C-section) might be important. You might also note prenatal exposure to potentially harmful substances, like alcohol and tobacco.
Characteristics of the child’s environment:
In adult study, you establish socioeconomic status (SES) by examining the level of education and the type of job held by the patient. You can’t do this for a child, of course, so you have to assess SES by education level of the parents and their job category. If you are assessing developmental delays, then should probably measure factors about the richness of the child’s environment, such as the number and types of toys available and the vocabulary skills of the primary caregiver. Where does the child spend most of the day? Childcare arrangements, such as enrollment in a daycare center can sometimes be very important. For older children, where they go to school is important, especially with the rise of home schooling.
Characteristics of the child’s diet.
The dietary information for a child is a bit different than of an adult, because a young child cannot fill out a food diary and must rely on a proxy report of diet. For infants, of course, you might need details about the duration of breastfeeding and the age at which solid foods were introduced.
What if you can’t measure these things?
In many research situations, but especially in pharmacovigilance studies, you will not have access to many of these child-specific variables. In some situations, the loss is trivial. What you do lose when you fail to collect this extra information is the ability to make risk adjustments. If these variables are imbalanced across comparison groups and these variables are strongly associated with a particular safety indicator, you have the most cause for concern.
Summary
In a research study involving children, you have several statistical concerns. First, you may need to take extra efforts to establish validity in measurements in children. Second, you have to deal with sample size concerns and subgroup analysis issues. Finally, you may need to collect a greater level of detail about the child’s age, information about the pre-natal exposures and delivery and possibly special data on the child’s environment and diet.