I was asked to “validate” a software program called OpenEpi. If you want to validate software, you need to show that it produces correct answers for a variety of test cases. This webpage outlines the range of test cases and demonstrates validity for those cases by comparing them to an alternative program and to published peer-reviewed research sources.
When there is a large disagreement, results will be adjudicated by hand calculation and/or comparison to a third program. Small disagreements are acceptable. Small is defined as no more than a one unit disagreement in the thid significant figure (e.g., 12.2 versus 12.1). If a program or research paper displays less than three significant digits, then perfect agreement between the displayed digits will be considered acceptable. An example of acceptable agreement in this case would be if one program displays a value of 0.0034 and the other displays a value of 0.003392. This is satisfactory because the second value, when rounded to two significant figures, matches the first value.
Open Epi produced no more than small disagreements with four artificial data sets and two published peer-reviewed research resources. Here are the details.
Artificial examples.
There are four artificial examples for evaluation of Open Epi and a comparison program. I chose epitools, a package in R, for comparison, because epitools produces many of the same confidence intervals and p-values. I wanted to look at sample sizes that were small and large. I also wanted one test case to have a large p-value and one test case to have a small p-value.
Here are the test cases.
Test Case 1

 5 10
10 40

Test Case 2

 5 10
10 90

Test Case 3

2000 4000
4000 9000

Test Case 4

2000 4000
4000 8100
Test Case 1
Here are the results of Test Case 1. For this and all other test cases, results from Open Epi are shown above the results from epitools/R. The number circles were added by the screen capture software.
The uncorrected chi square p-values (1) match to the third decimal place. The Mid-P exact p-values match to our decimal places. Note the discrepancy between the Fisher exact p-values (3) though. This is not an error–the two programs use different formulas for calculating these p-values, as I have verified through hand calculations.
The Mid-P Exact and Fishers Exact confidence limits (1) agree to four significant digits. The Taylor series confidence limits agree to three significant digits.
Test Case 2
Here are the results for Test Case 2.
The uncorrected chisquare (1) and Mid-P Exact (2) p-values agree to four significant digits.
The Mid-P Exact confidence intervals (1) agree to three significant digits and the Fisher Exact (2) and Taylor series (3) confidence intervals agree to four significant digits.
Test Case 3
Here are the results for test case 3.
Like many statistical software programs, Open Epi does not compute Fisher’s exact test for a sample size this large. This is perfectly acceptable because Fisher’s exact test becomes increasingly difficult to compute for increasing sample sizes. The calculations in this test case, for example, require the computation of probabilities for up to 6,000 tables.
The uncorrected chi square p-values (1) are relatively easy to compute, even for large sample sizes. The p-values agree to four significant digits.
The confidence intervals also agree to at least four significant digits.
Test Case 4.
Here are the results for test case 4.
The p-values agree to at least four significant digits.
The confidence intervals also agree.
Peer-reviewed paper 1
The first peer-reviewed example comes from Sanna Siponen, Riitta Ahonen, Piia Savolainen, Katri Hameen-Anttila. Children’s health and parental socioeconomic factors: a population-based survey in Finland BMC Public Health. 2011;11(1):457. Available in html format.
Here is Table 3 from that paper.
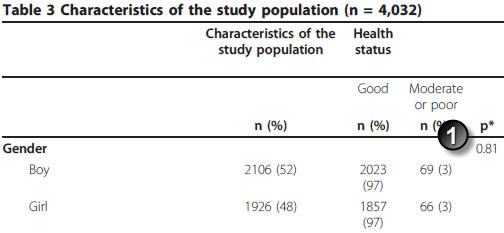
Note in this example that there are 17 missing values (14 among boys and 3 among girls). That accounts for the decline in total sample size from 4,032 to 4,015.
The p-value (1) is 0.81. You need to take the time to verify that the paper used the uncorrected chi square test, which it does. Here are the results from OpenEpi.
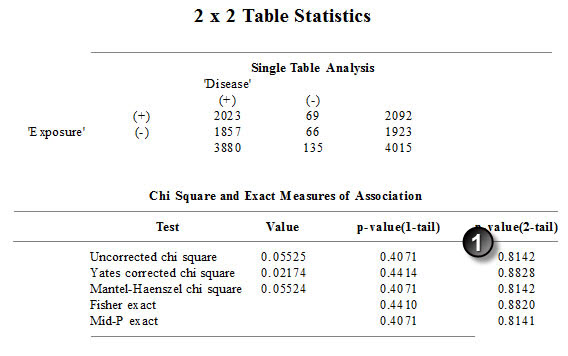
This is a perfect match.
Peer-reviewed paper 2
Here’s another example:
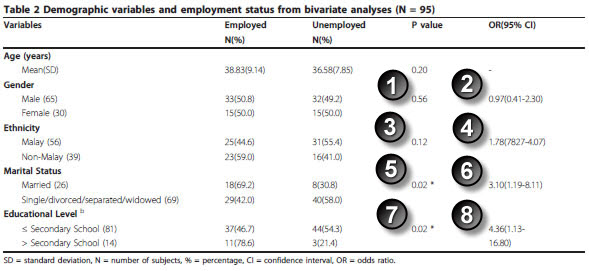
Marhani Midin, Rosdinom Razali, Ruzanna ZamZam, Aaron Fernandez, Lim C Hum, Shamsul A Shah, Rozhan SM Radzi, Hazli Zakaria, Aishvarya Sinniah. Clinical and cognitive correlates of employment among patients with schizophrenia: a cross-sectional study in Malaysia Int J Ment Health Syst. 2011;5(1):14. Available in html format or pdf format.
You have to skip the age variable, but you can replicate the two by two tables for gender, ethnicity, marital status, and eduation level.
Here are the results for gender:

The Fisher exact p-value matches the p-value in the paper.
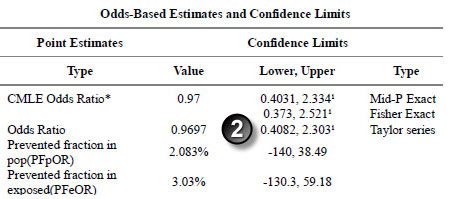
The Taylor Series confidence interval matches the interval in the paper.
Here are the results for ethnicity.

The p-values match.
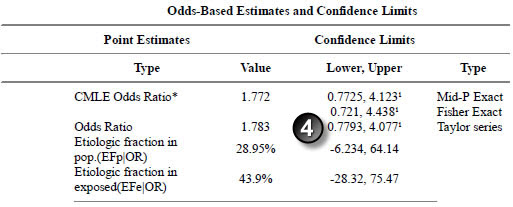
The confidence intervals match (let’s allow a bit of latitude for rounding error here).
Here are the results for marital status.

The p-values match.
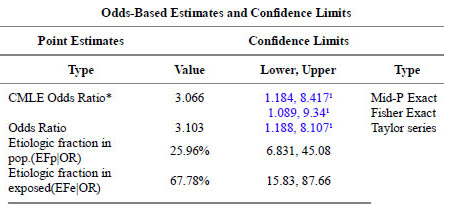
The confidence intervals match.
Here are the results for education level.

The p-values match.
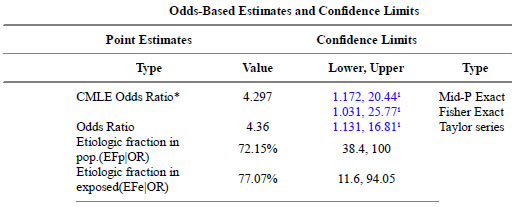
The confidence intervals match.
You can find an earlier version of this page on my original website.