The concept of controlling for a third variable is an important one to understand in Statistics. When you are looking at data without the benefit of randomization, sometimes an examination of the relationship between two variables can be distorted by a third variable. The third variable might create an false association between those two variables or it might mask a real association.
There are several ways to account for that third variable when examining interfere with your analysis of a relation. A common approach is to use a partial correlation, which effectively adjusts for the third variable or holds the third variable constant when examining the relationship.
Partial correlation
- \(r_{XY\cdot Z}=\frac{r_{XY}-r_{XZ}\times r_{YZ}} {\sqrt{1-r_{XZ}^2}\sqrt{1-r_{YZ}^2}}\)
Here is the formula for partial correlation. Read \(r_{XY\cdot Z}\) as the correlation between X and Y holding Z constant, or the correlation between X and Y adjusted for Z.
Look at the numerator. It takes the unadjusted correlation of X and Y and subtracts a product of the correlation of each of them with Z. This tells you something important right away. The adjustment is small if the product is small, meaning either that X is not strongly associated with the third variable, Z or Y is not strongly associated with Z. The adjustment is large when both X and Y have a strong positive or negative association with Z.
The denominator will actually modify things even further. If \(r_{XZ}\) is large negative or large positive, then the term \(\sqrt{1-r_{XZ}^2\) will be small. A small value in the denominator makes the whole fraction big. A similar pattern occurs when \(r_{XZ}\) is large negative or large positive.
If the third variable correlates poorly with both X and Y, then the adjusted correlation is not too much different from the unadjusted correlation.
An example of partial correlation
Let’s look at an example. A pediatric study of lung function measured forced expiratory volume (FEV) in a sample of children ages 3 through 17. FEV is a measure of how much air you can blow out of your lungs. It is expected to increase with age.
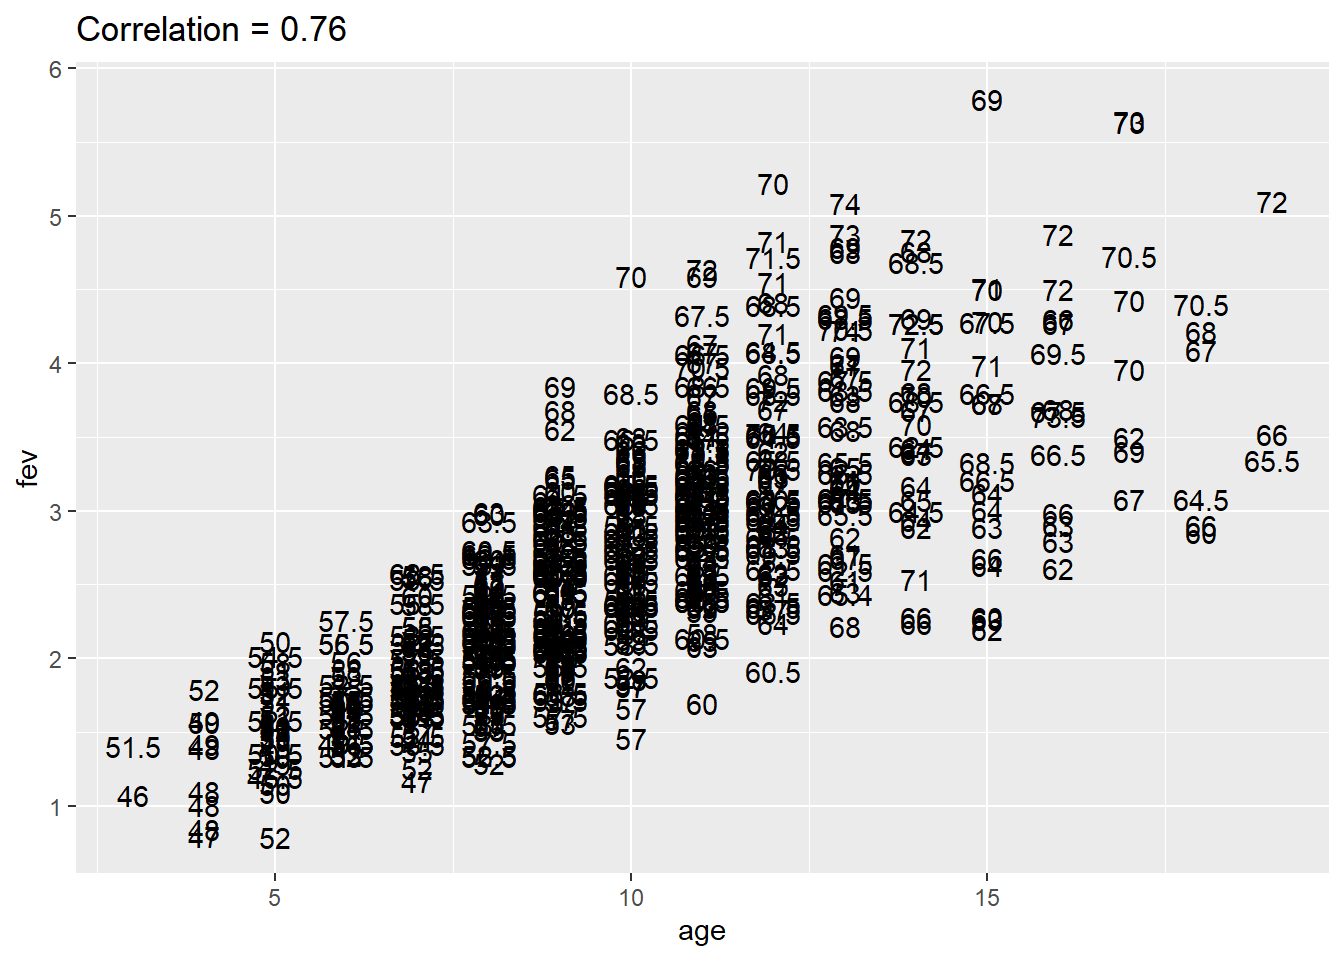
- The correlation of FEV with age is 0.76.
But there is a third factor, height, which might account for this relationship.
- The correlation of FEV with height is 0.87
- The correlation of age with height is 0.79
Unadjusted relationship between age and FEV
If you look at all of the data, you see a strong correlation between age and FEV. This graph shows the individual heights for each child at the X, Y value corresponding to the age and FEV. Notice that the younger children have heights in the high 40s and the low 50s and the older children have heights in the high 60s and low 70s.
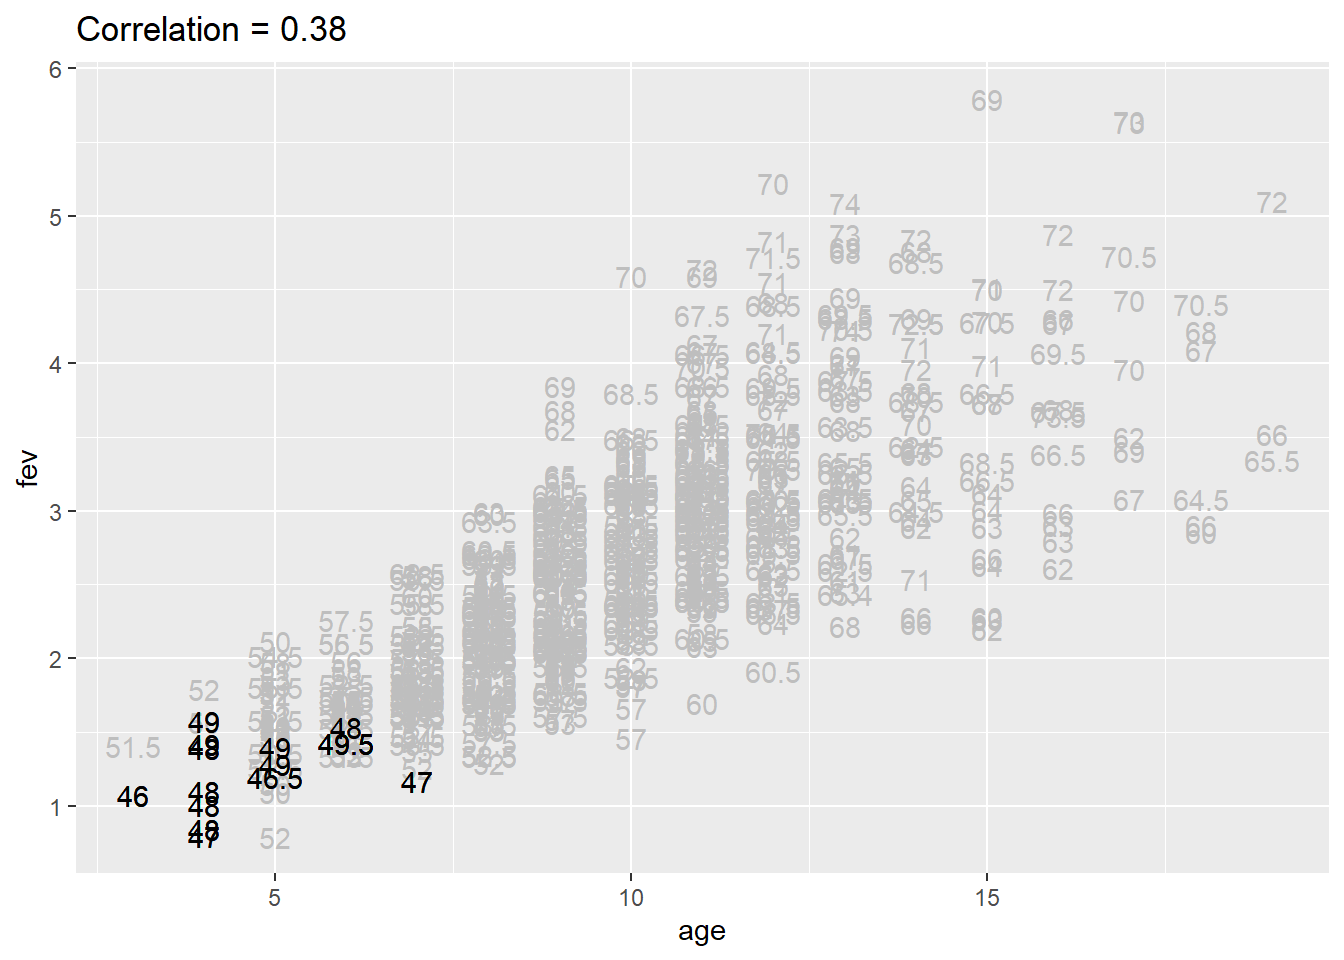
Relationship between age and FEV controlling for height between 46 and 49.5
When you look at the shortest kids, those with heights between 46 and 49.5, you see that the correlation is weak.
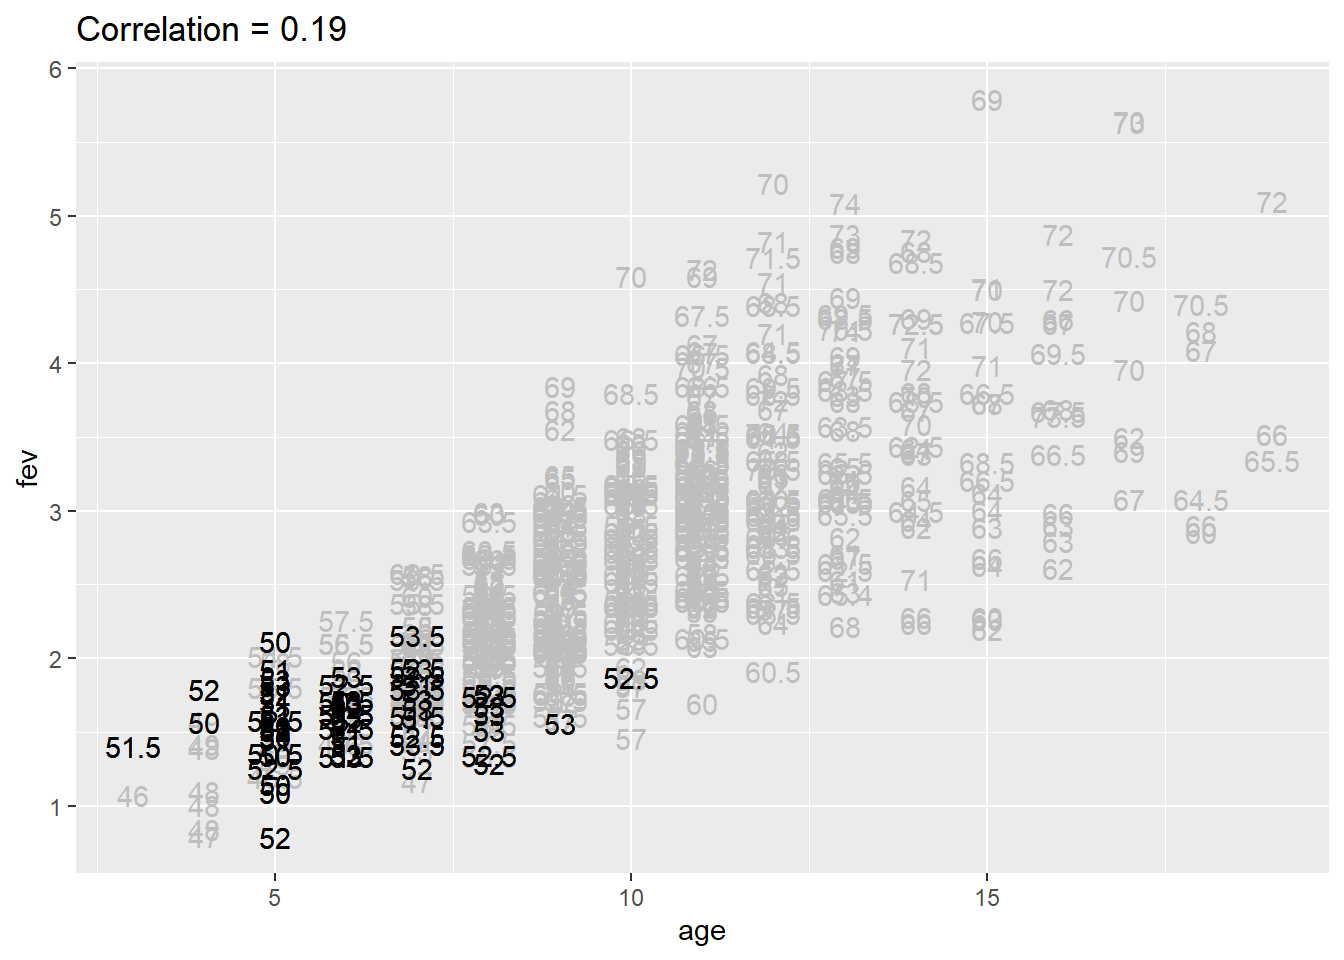
Relationship between age and FEV controlling for height between 50 and 53.5
You see a similar weak correlation when the height is between 50 and 53.5.
And so forth.
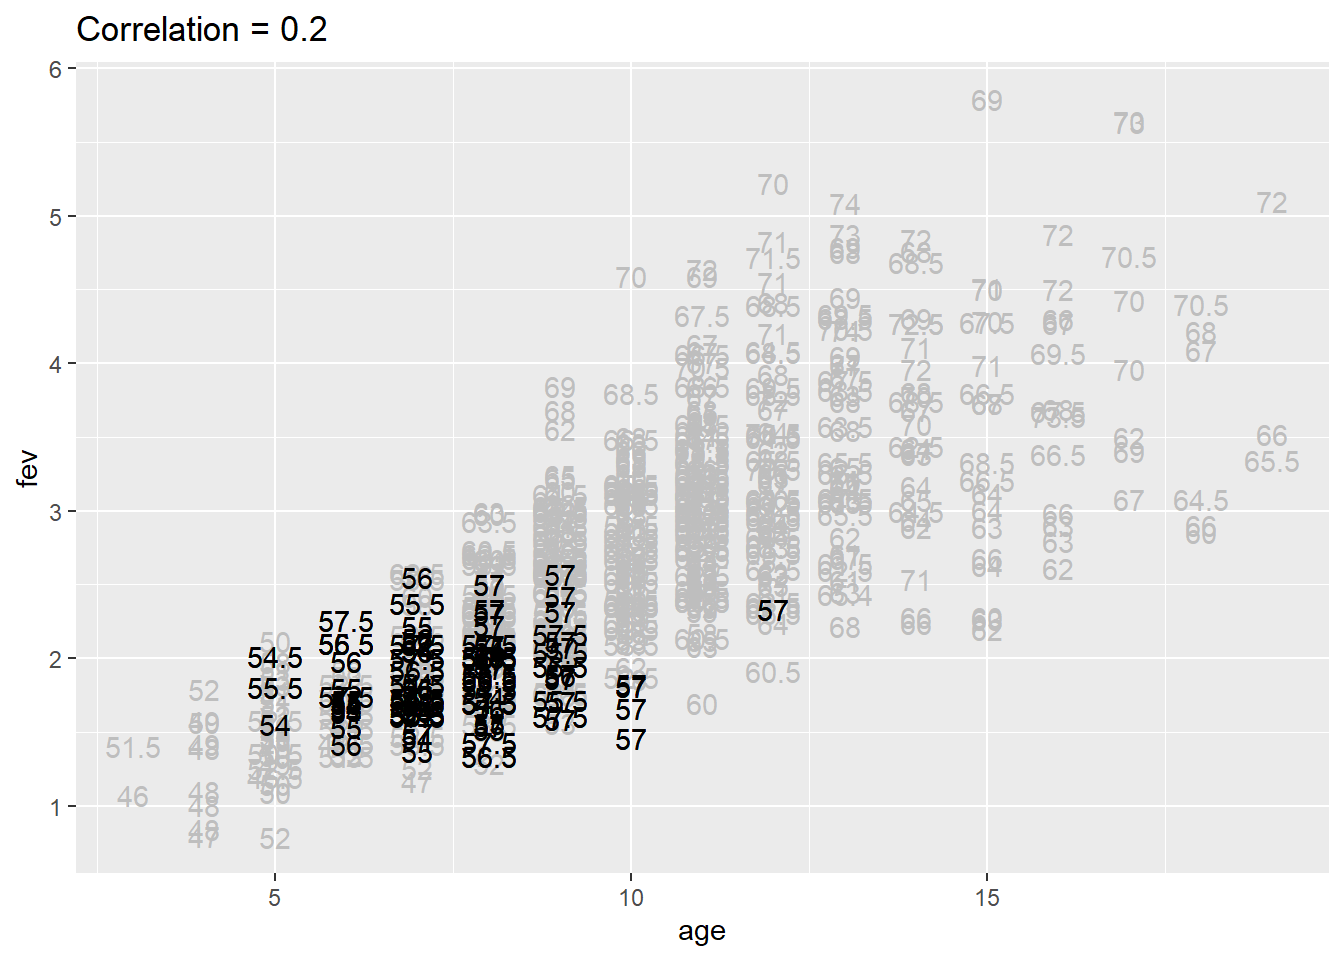
Relationship between age and FEV controlling for height between 54 and 57.5
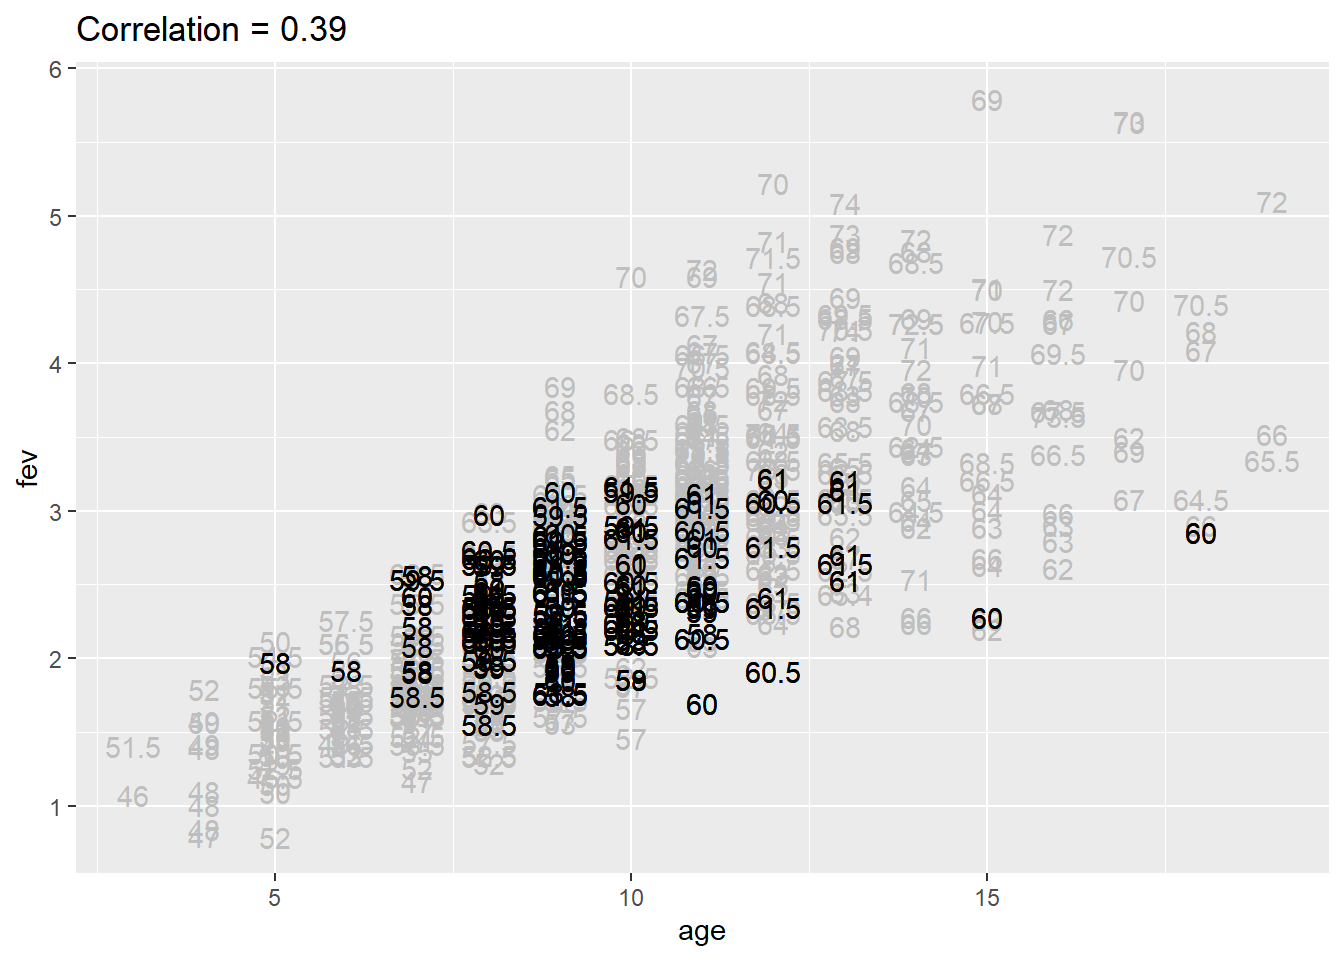
Relationship between age and FEV controlling for height between 58 and 61.5
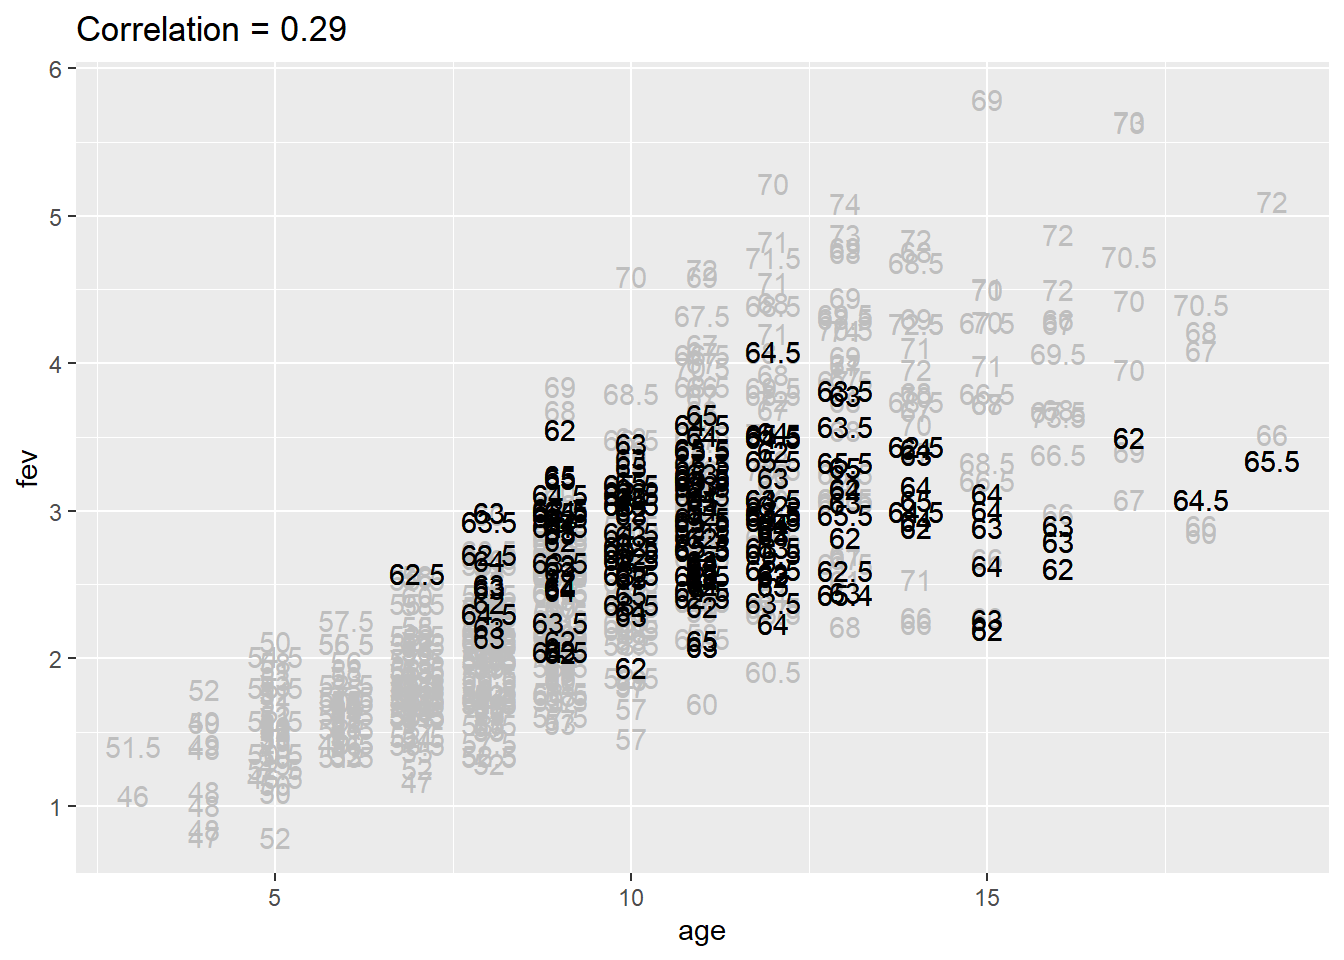
Relationship between age and FEV controlling for height between 62 and 65.5
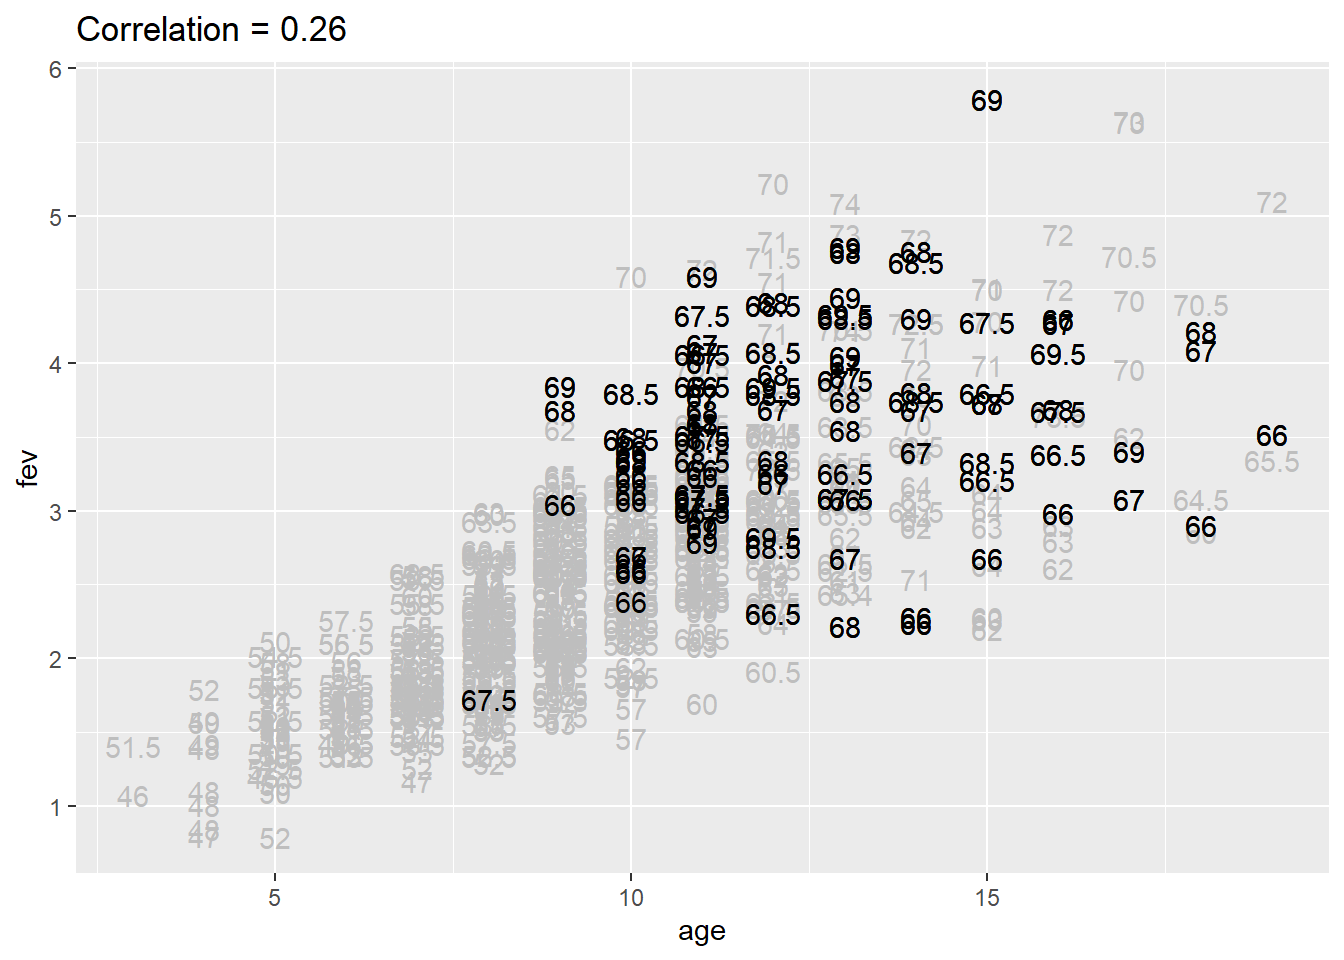
Relationship between age and FEV controlling for height between 66 and 69.5
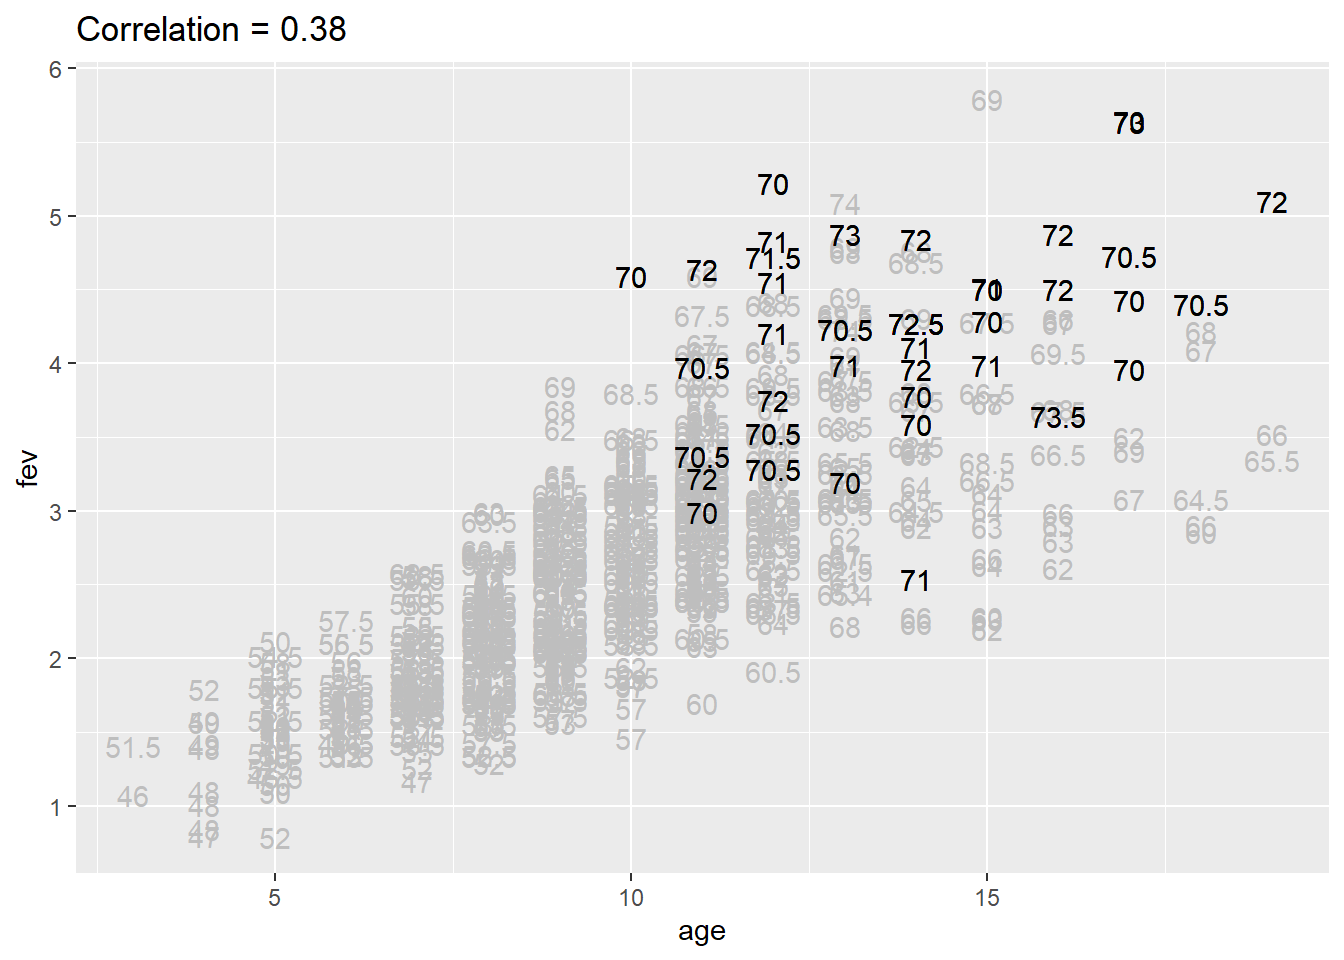
Relationship between age and FEV controlling for height between 70 and 73.5
Partial correlation calculation
The formal calculation of the partial correlation is shown here.
- \(\frac{0.76-0.87 \times 0.79}{\sqrt{1-0.87^2}\sqrt{1-0.79^2}} = 0.24\)
The correlation between age and FEV is very weak when you adjust for the child’s height.