The following data represents a weekly evaluation of vaccine potency. The data is taken from
- H. C. Batson, M. Brown, M. Oberstein. An adaptation of quality control chart methods to bacterial vaccine potency testing. J Bacteriol 1951: 61(4); 407-19. Available in pdf format.
but I have taken some liberties with the data to simplify the calculations.
Week01 0.716 0.771 0.924
Week02 0.978 1.212 1.176
Week03 0.644 0.903 0.869
Week04 0.869 0.716 0.869
Week05 1.398 1.301 0.934
Week06 1.218 0.924 1.398
Week07 0.876 0.591 0.644
Week08 1.215 1.241 1.021
Week09 1.021 0.954 0.491
Week10 0.690 0.477 0.785
Week11 1.301 1.279 1.220
Week12 1.644 1.176 1.114
Week13 1.146 1.256 1.518
Each week, three lots of vaccine are tested for potency. Calculate a control chart for this data.
While many experts in quality control would use an XBAR-R chart for this data, the XBAR-S chart also works well. There are three steps in calculating an XBAR-S chart.
- Compute a mean and standard deviation for each group,
- Plot the means/standard deviations in sequence (i.e., a run chart),
- Draw reference lines at the overall mean and at the three sigma limits.
The mean and standard deviation for each week are shown below
       Mean  Stdev
Week01 0.804 0.108
Week02 1.122 0.126
Week03 0.805 0.141
Week04 0.818 0.088
Week05 1.211 0.245
Week06 1.180 0.239
Week07 0.704 0.152
Week08 1.159 0.120
Week09 0.822 0.289
Week10 0.651 0.158
Week11 1.267 0.042
Week12 1.311 0.290
Week13 1.307 0.191`
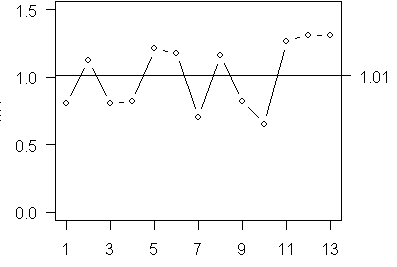
Here is a plot of the means

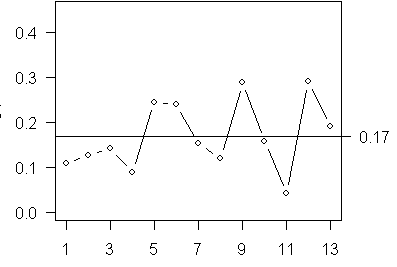
and of the standard deviations.

I have included a single reference line at the average of all the data points. For these two charts, the data values fluctuate more or less randomly above and below the reference line. If you noticed eight or more consecutive points on the same side of the center line, you would declare the process to be out of control.
The final step is to compute control limits. These limits are placed at three sigma distance from the overall mean and variation inside these limits is considered normal variation. The formula for control limits for the XBAR chart is

where the constant A3 comes from the following table.
  n A3    B3    B4
  2 2.659 0     3.267
  3 1.954 0     2.568
  4 1.628 0     2.266
  5 1.427 0     2.089
  6 1.287 0.030 1.970
  7 1.182 0.118 1.882
  8 1.099 0.185 1.815
  9 1.032 0.239 1.761
 10 0.975 0.284 1.716
 11 0.927 0.321 1.679
 12 0.886 0.354 1.646
 13 0.850 0.382 1.618
 14 0.817 0.406 1.594
 15 0.789 0.428 1.572
 16 0.763 0.448 1.552
 17 0.739 0.466 1.534
 18 0.718 0.482 1.518
 19 0.698 0.497 1.503
 20 0.680 0.510 1.490
 21 0.663 0.523 1.477
 22 0.647 0.534 1.466
 23 0.633 0.545 1.455
 24 0.619 0.555 1.455
 25 0.606 0.565 1.435`
This table can be found in many books and on several websites.
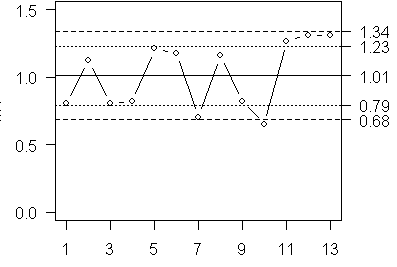
In this particular example, n=3, so A3=1.954. This produces lower and upper control limits of 0.68 and 1.34. If a single data point falls outside the control limits, your process is out of control.
It is optional, but you can also compute warning limits at two sigma units away from the mean. If you notice two out of three consecutive points outside the warning limits, then your process is out of control. Here is a control chart that includes warning limits.

Notice that the tenth week is below the lower control limit and that two consecutive weeks (11 and 12) fall above the upper warning limit. You can also compute control limits for the standard deviations using the formula

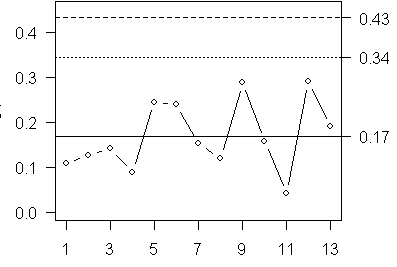
where the constants B3 and B4 come from the same table. When n is small (5 or less), the value of B3 is zero which places no effective lower control limit on the chart. What this tells you is that an individual standard deviation can be extremely small without raising any concern.
Here is a plot of the standard deviations with control limits.

There are no points outside the control or warning limits.
On your own.
Compute a control chart for the following data set (see below). This data set represents vaccine potencies, like the above data set, but it uses fixed standards to assess potency. These numbers appear in the same paper, but again some simplifying assumptions have been made. Don’t peek until you’ve done the work, but the answers are available on a separate web page.
Week01 1.097 1.204
Week03 1.030 1.362
Week05 0.682 0.978
Week07 0.820 1.080
Week09 1.042 0.858
Week11 1.398 1.146
Week13 1.301 1.204`
You can find an earlier version of this page on my old website.